PALMERSTON NORTH CITY
COUNCIL
Memorandum
TO: Economic Development Committee
MEETING DATE: 12 March 2018
TITLE: Summary Report on the December 2017 Manawatū Quarterly Economic
Monitor, Residential Housing Building Consents, Major Developments and
Quarterly Retail Report for January 2018
DATE: 28 February 2018
AUTHOR/S: Peter Crawford, Economic Policy Advisor, City Future
Linda Stewart,
Chief Executive, CEDA
|
RECOMMENDATION(S) TO Council
1. That the December 2017 Manawatu
Quarterly Economic Monitor, Residential Building Consents, Major Developments
and Quarterly Retail Report is received
|
1. Overview
1.1 This
memorandum presents a summary of:
1.1.1 the
key themes in the latest Manawatū Quarterly Economic Monitor for the
December 2017 quarter,
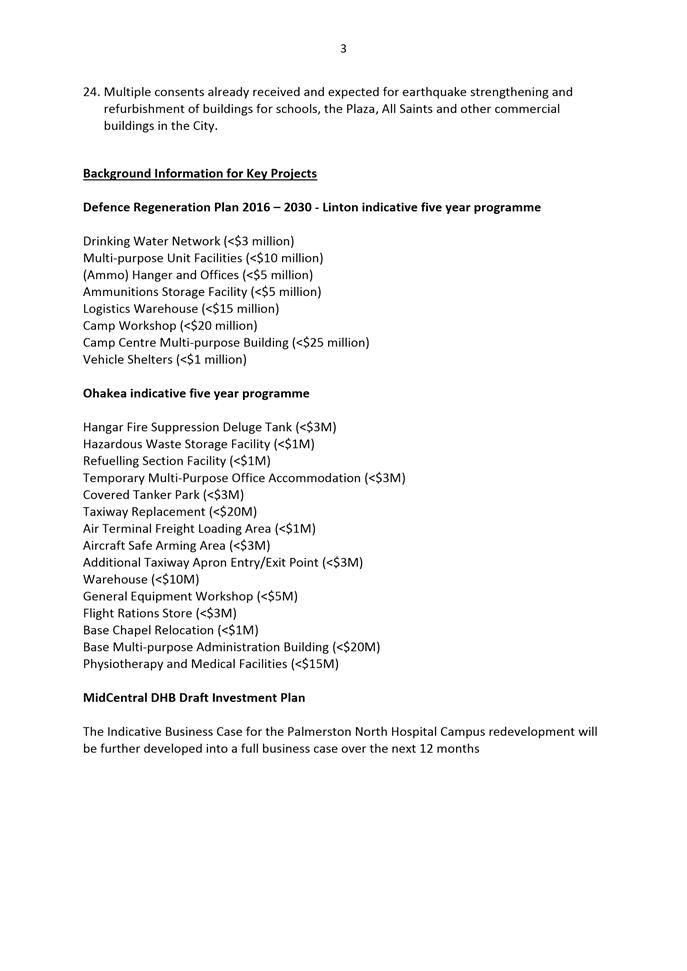
1.1.2 the
results of the requested review of statistics on new residential housing and
ring-fencing relocatable houses that are not for the city
1.1.3 the
outlook for major construction projects in the region; and
1.1.4 the
latest CEDA retail report for the three months ended January 2018.
1.2 The
latest Manawatū Quarterly Economic Monitor report indicates weaker GDP
growth in the region in the year ended December 2017 due to slower economic
growth in the December quarter and weaker employment growth. There was a
slowing in growth in the construction sector, with an increase of just 2% in
the number of new residential dwellings in the quarter, the weakest quarterly
growth rate since June 2015. There was also a small decline in domestic
tourism spending in the quarter. An error in Statistics New Zealand
annual employment data for Palmerston North is likely to be a more significant
factor in revised growth estimates for 2017. Ezibuy employee counts have
been lost from the employee count data for the city, and the data for 2017 will
not be revised until 2018 employment data is published in October 2018.
1.3 A
significant improvement in the rate of growth in economic activity is expected
over the next 12 months due to stronger population growth, increased building
activity, jobs being transferred into the region (such as Fairfax, AgResearch
and Ernest Adams) and continuing strength in primary sector incomes.
1.4 Net
overseas migration in the region increased by 12% in the year to December, a
much stronger trend compared with the national decline of 1%, a good indication
of continuing improvement in economic prospects in the region. There was
a 6% decline of the number of people leaving the region to move overseas in the
year to December 2017, with the 975 people who left on a long-term or permanent
basis the lowest annual number in the series that began in 1990. The
number of people leaving from New Zealand increased by 9% in the year to
December.
1.5 There
has been a significant gain in net overseas migration in the region for people
aged under 40 years. There were 782 people aged between 0 and 39 years
who left on a long-term or permanent basis in 2017 compared with the 10-year
average of 1,159 people, while there were 1,434 arrivals compared with the
10-year average of 1,316 people. This resulted in a net gain of 652
people aged between 0 and 39 years compared with a 10-year average gain of 241
people.
2. manawatū
quarterly economic monitor – december 2017
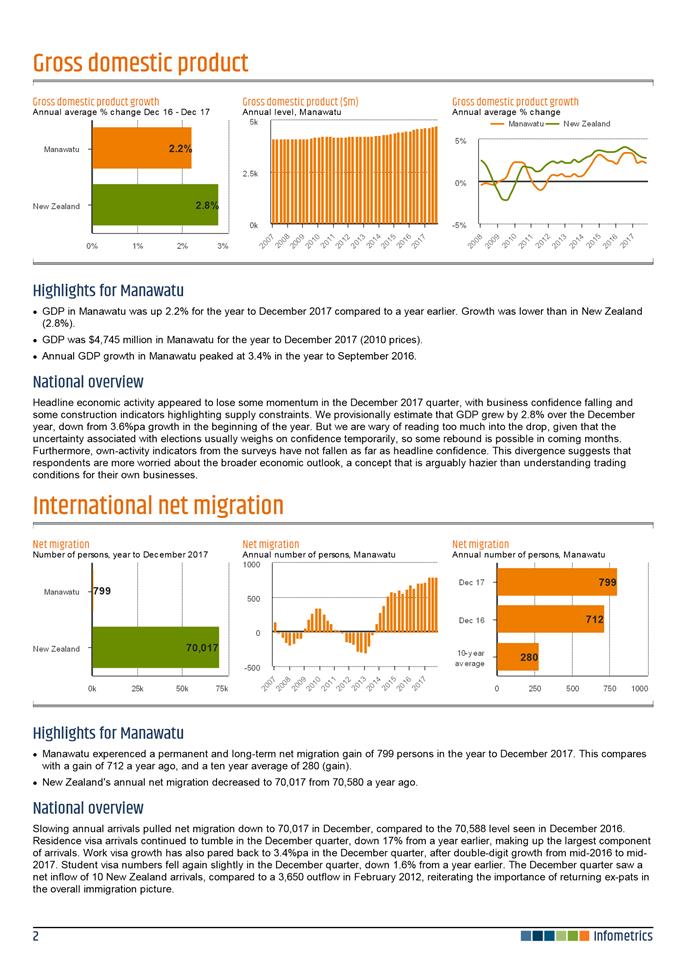
2.1 Estimated annual gross domestic product (GDP)
growth in the Manawatū region was 2.2% in the year ended December 2017,
compared with an increase of 2.4% in the year to September 2017 (the previous
estimate was an increase of 2.9%). New Zealand GDP is estimated to have
increased by 2.8% in the year to December 2017, a weakening from the 2.9%
increase in the year to September.
a. Palmerston
North GDP increased by 1.7%,
b. Manawatū District GDP increased by 4.3%.
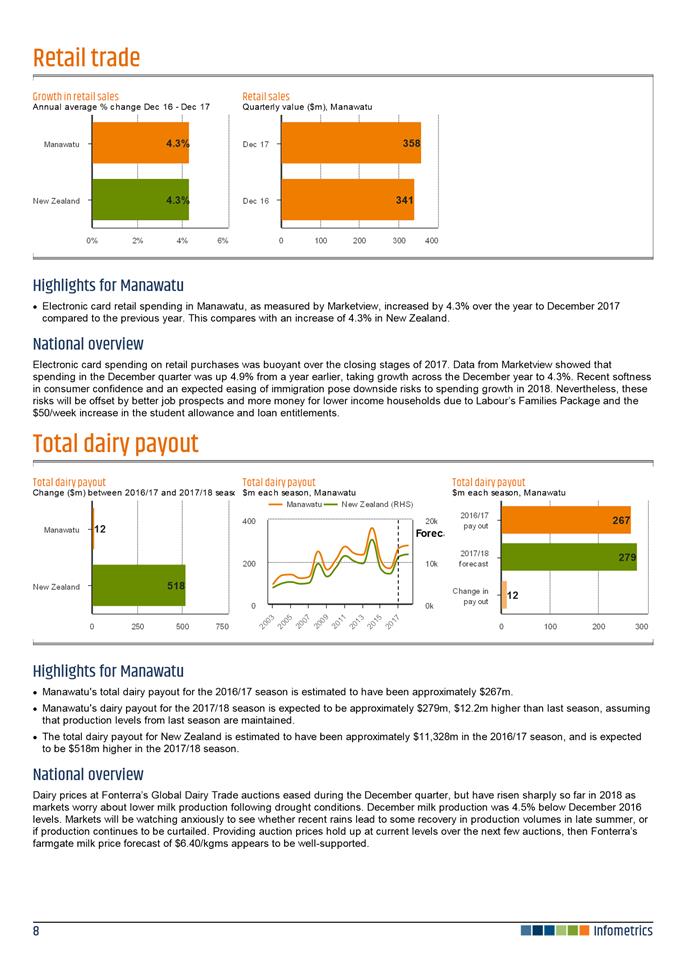
2.2 Electronic card retail spending in the
Manawatū region in the December quarter was $358 million, an increase of
5.1% from the December 2016 quarter, while national growth was 4.6%. Statistics
New Zealand estimates that retail prices increased by 0.8% in the year to
December 2017.
a. Annual electronic card retail spending in the region for
the year ended December 2017 was $1,282 million, an increase of 4.3% from 2016.
This compares with an increase of 4.1% for New Zealand.
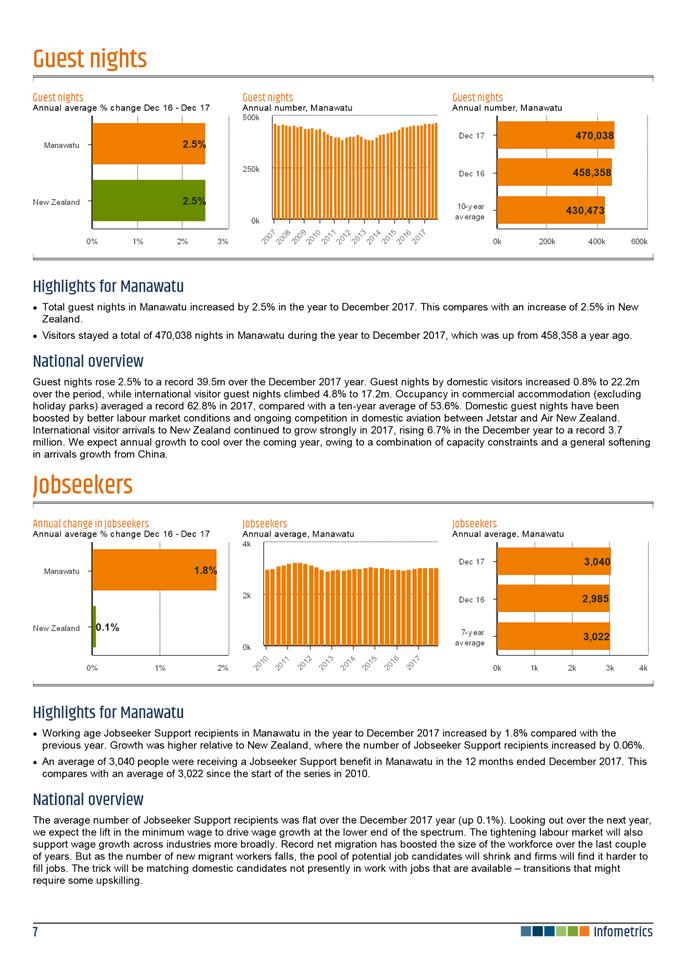
2.3 Commercial accommodation guest nights in the
Manawatū region increased by 4.7% in the December 2017 quarter from the
December 2016 quarter, while national guest nights increased by 4.3%. A
change in the timing of the national secondary schools basketball tournament in
Palmerston North from 26 September – 1 October in 2016 to 2 – 7
October in 2017 is a factor contributing to the increase in guest nights in the
December quarter.
a. Annual
commercial guest nights in the Manawatū region were 470,038 in the year
ended December 2017, an increase of 2.5% from the previous year. This compares
with an increase of 2.5% for New Zealand.
2.4 The total value of building consents issued in
the region in the December quarter was $71 million, compared with $62 million
in the December 2016 quarter, an increase of 14%. National consent values
increased by 6%.
a. Building consents to the value of $277 million were issued
in the region in the year to December 2017, an increase of 20% from the
previous year. National consent values increased by 8% over the same period.
b. Consents for 119 new residential dwellings were issued in
the region in the December 2017 quarter, compared with 117 in the December 2016
quarter, an increase of 2%. National consents increased by 3%. This data
differs from the numbers published in the Infometrics report due to adjustments
made for consents issued for Presidential Homes.
c. Consents for 526 new residential dwellings were issued in
the region in the year ended December 2017, compared with 413 in the previous
year, an increase of 27%. National consents increased by 4%.
d. Non-residential consents to the value of $89 million were
issued in the region during the year to December 2017, an increase of 6% from
the previous year. National consents increased by 8% over the same period.
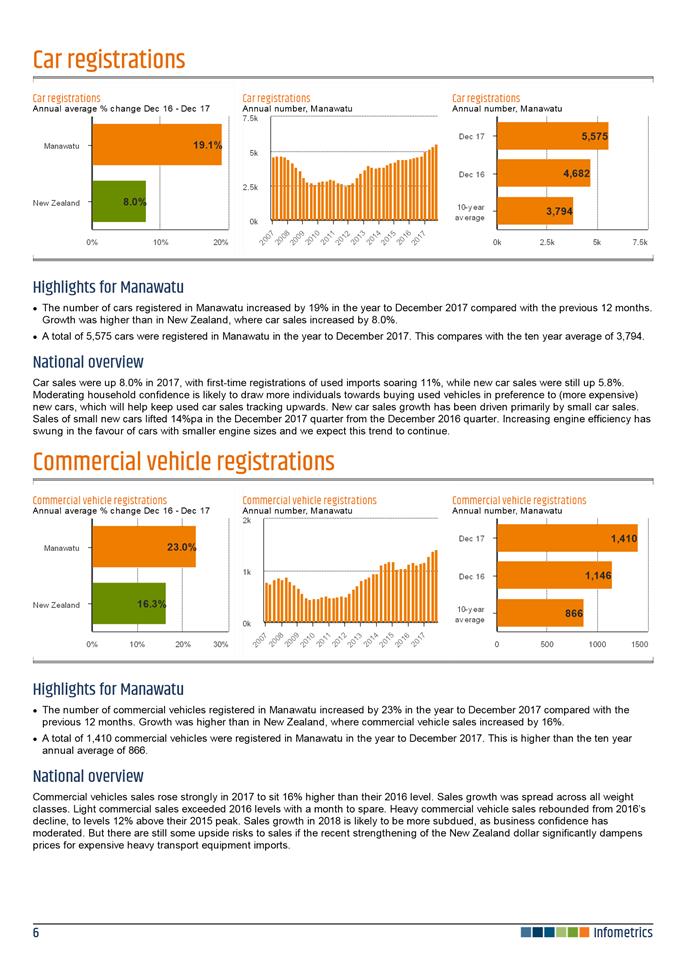
2.5 Car registrations in the region increased by
19.1% in the year ended December 2017 (national registrations increased by
8.0%) while the number of commercial vehicles registered increased by 23%
(compared to a national increase of 16%).
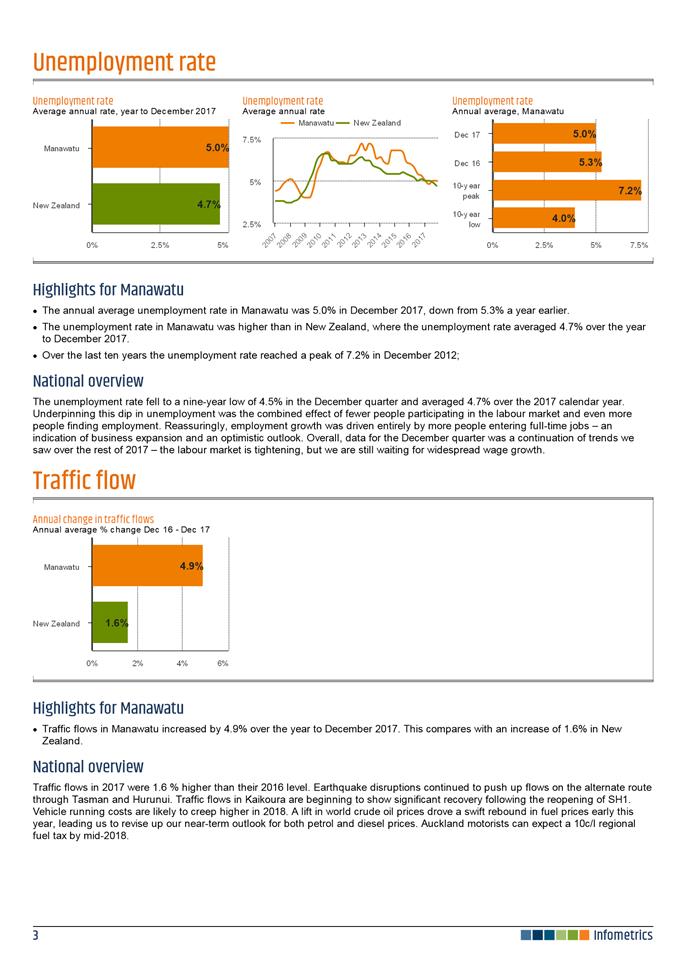
2.6 It is estimated the annual average unemployment
rate in the Manawatū region in the year ended December 2017 was 5.0%,
which was slightly above the unemployment rate of 4.7% for New Zealand.
2.7 The number of people in the region registered
for the MSD Job Seekers benefit increased by 1.0% in December 2017 from
December 2016, while the number in New Zealand declined by 1.0%. The MSD
benefit numbers reported in the Infometrics report are based on the average of
the last four quarters.
2.8 Traffic flows in the Manawatū region in the
year to December 2017 increased by 4.9% from 2016, while there was an increase
of 1.6% for New Zealand.
2.9 The Manawatū region experienced a net gain
of 799 people from overseas migration in the year ended December 2017, compared
with a net gain of 712 people in the year to December 2016. The average annual
gain in the region over the last 10 years was 280 people.
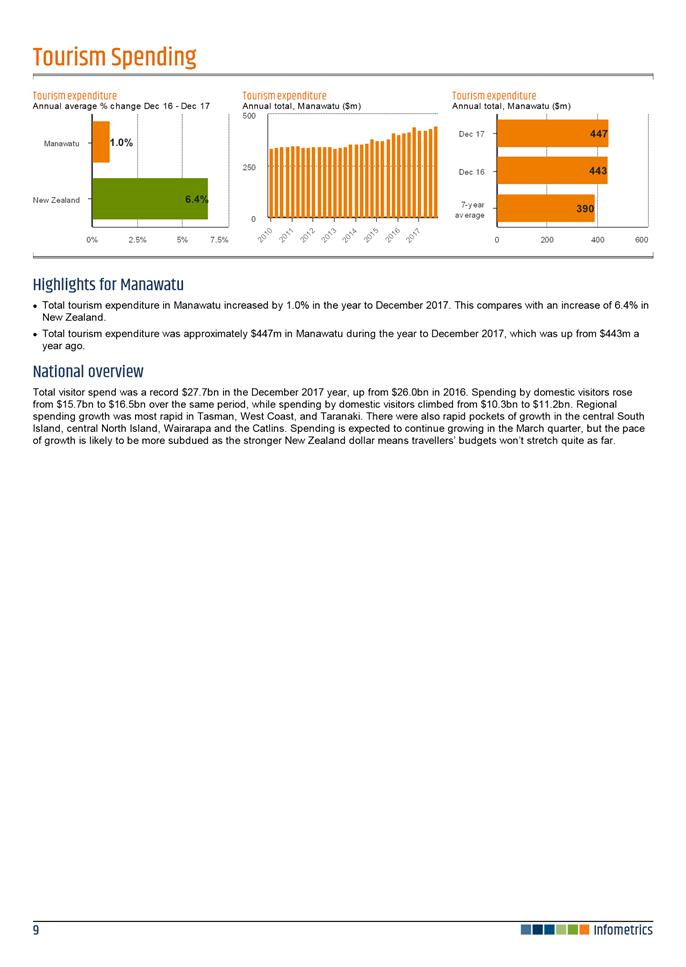
2.10 Tourism spending in the Manawatū region in the
December quarter was $121 million, an increase of 0.9% from the December 2016
quarter. Total tourism spending in New Zealand increased by 11.7%.
a. Total
visitor spending in the region was $447 million in
the year ended December 2017, increasing by 1.0% from the previous year (6.9%
increase for New Zealand).
b. Domestic visitor spending in the region was $380 million in
the year ended December 2017, declining by 0.1% from the previous year (4.8%
increase for New Zealand). The weakness in domestic visitor spending was due to
declines in spending from Auckland (7.4% decline) and Taranaki (8.0% decline).
c. International visitor spending in the region was $68
million in the year ended December 2017, increasing by 8.0% from the previous
year (8.9% increase for New Zealand). Countries contributing the most to the
increase in spending in the region were China, the USA and the rest of Europe
(excluding Germany and the United Kingdom).
2.11 A
copy of the report is attached as Appendix 1.
3. review
of statistics for new residential housing
3.1 A discrepancy was identified in December 2017 between the number of
new dwelling consents included in the file submitted to Statistics New Zealand
for October 2017 and the official numbers published by Statistics New Zealand
for the number of new dwelling consents approved in Palmerston North.
Contact was made with Statistics New Zealand and it identified that five
consents had been incorrectly classified as residential additions and
alterations instead of as new dwellings. Statistics New Zealand subsequently
reviewed all consents lodged for Presidential Homes since January 2016 and
found 12 consents that had been classified as residential additions and
alterations and two which had been classified as non-residential
consents. With over 30,000 new dwelling consents approved nationally
during 2017, the department has advised it will not revise the official data
but has put in place processes to check the consents being received for
relocatable houses. Checking of the data being supplied to Statistics New
Zealand has also identified a few issues with the information supplied by
Council and further checks will be made before the file is submitted.
3.2 The other information requested at the 11 December Economic
Development Committee was the number of relocatable homes that were being
transported to other territorial authorities. Information supplied by
Presidential Homes shows that code compliance certificates (CCC) have not been
issued for one-third of the new dwellings consented since January 2016, due to work
not starting on the construction of the new dwelling consented. Where a
CCC has been issued, the company was not able to supply destination details for
nine dwellings but has provided details for 58 dwellings. This data shows
that 15 dwellings were relocated to a site in Palmerston North while 43 were
relocated to other local authorities throughout the lower half of the North
Island.
3.3 The company advised that at the time of lodging consents, it does
not always know where the house will be relocated to. When it does know
the address for where the house will be relocated to, it is now including this
data with the consent application. We will survey the company on a
quarterly basis to seek updated data on the destination of houses which have
been completed. A similar process will need to be initiated with Kynoch
Construction, which has also begun the construction of relocatable houses.
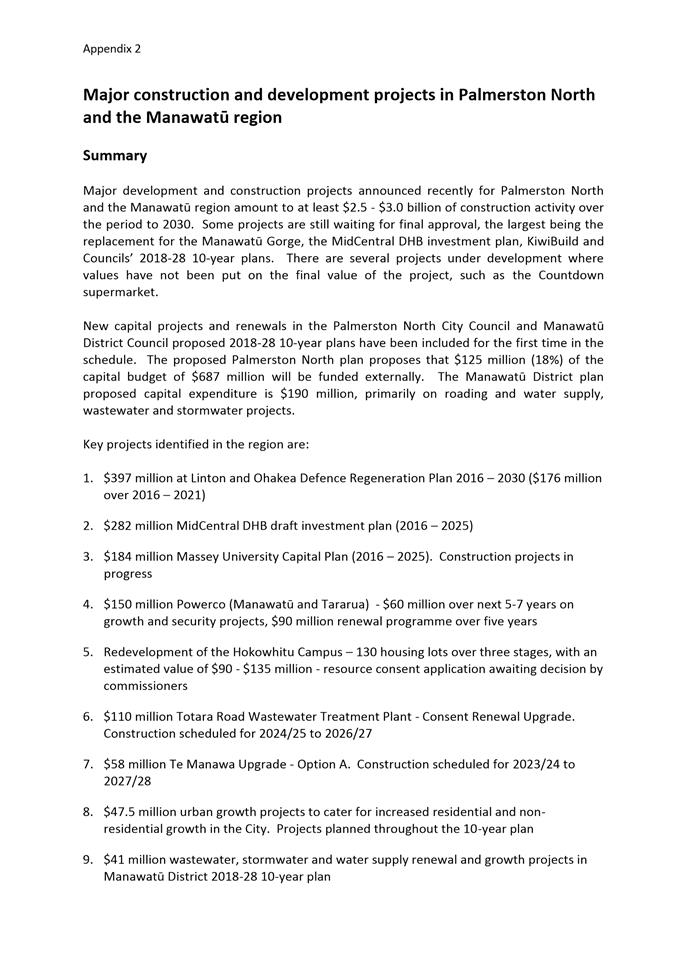
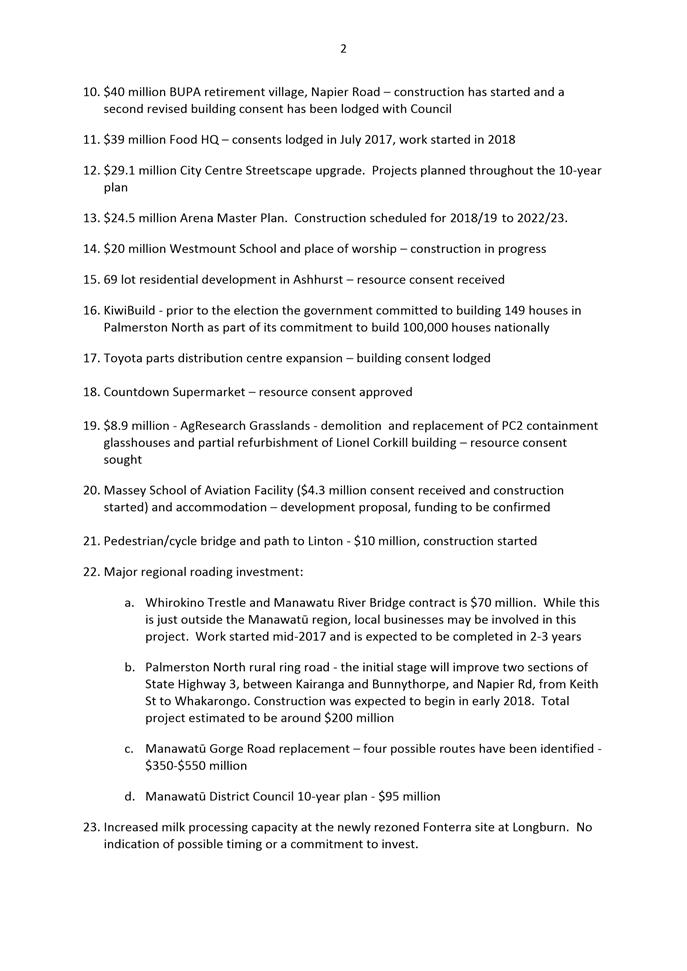
4. major
developments
4.1 Major development and construction projects announced recently for
Palmerston North and the Manawatū region amount to at least $2.5 - $3.0
billion of construction activity over the period to 2030. Some projects
are still waiting for final approval, the largest including the Manawatū
Gorge, Councils’ 2018-28 10-year plans and the MidCentral DHB investment
plan. There are several projects under development where estimates have
not been put on the final value of the project, such as the Countdown
supermarket. There is also an increasing number of smaller projects under
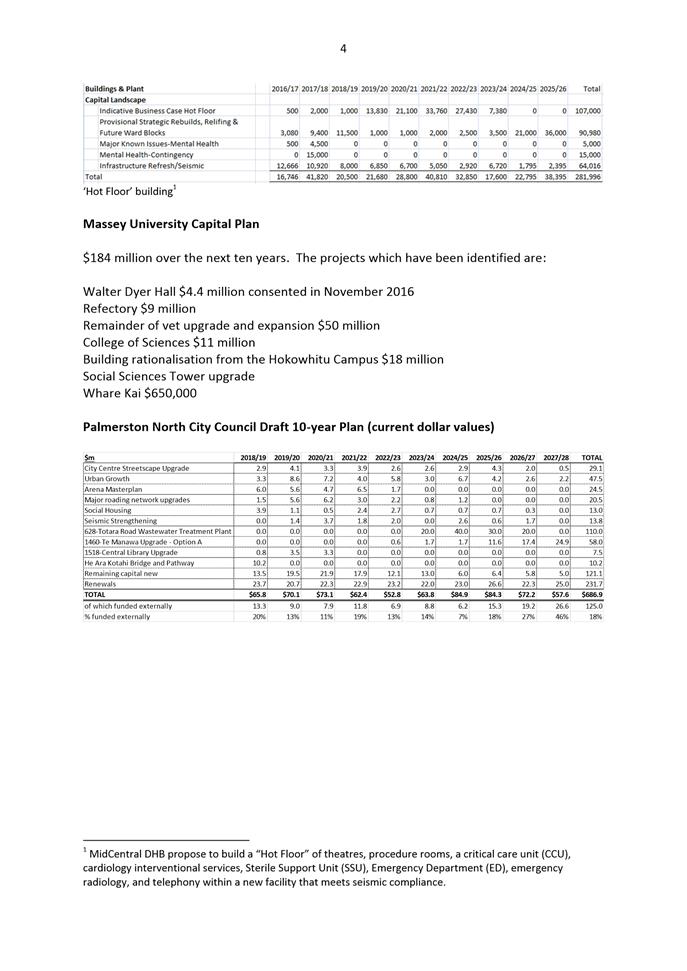
development.
4.2 New capital projects and renewals in the Palmerston North City
Council and Manawatū District Council proposed 2018-28 10-year plans have
been included for the first time in the schedule. The Palmerston North
plan proposes that $125 million (18%) of the capital budget of $687 million
will be funded externally. The Manawatū District plan proposed
capital expenditure is $190 million, primarily on roading and water supply,
wastewater and stormwater projects.
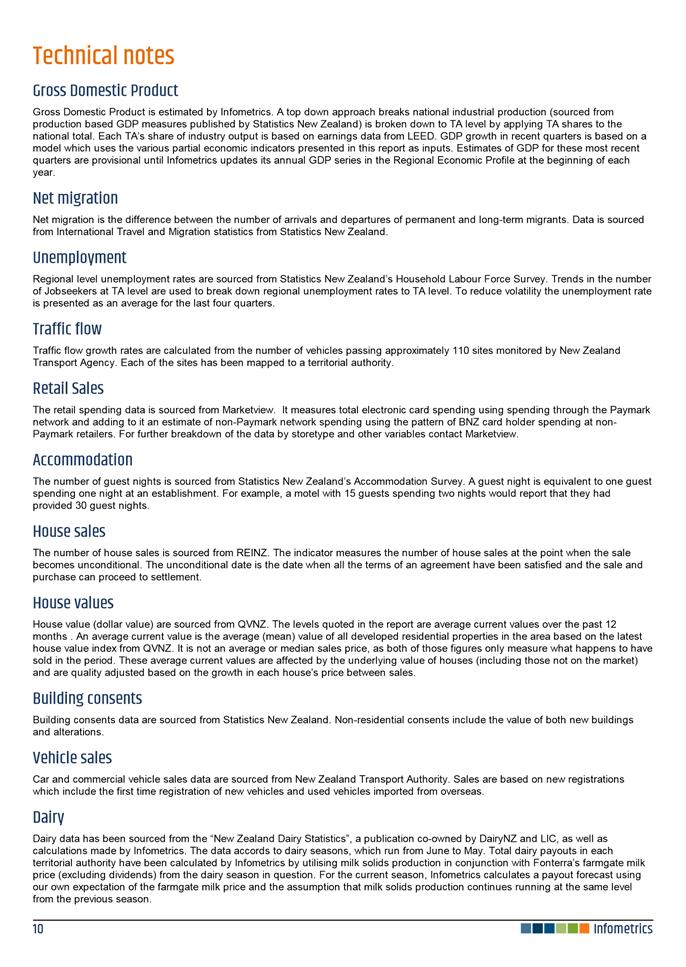
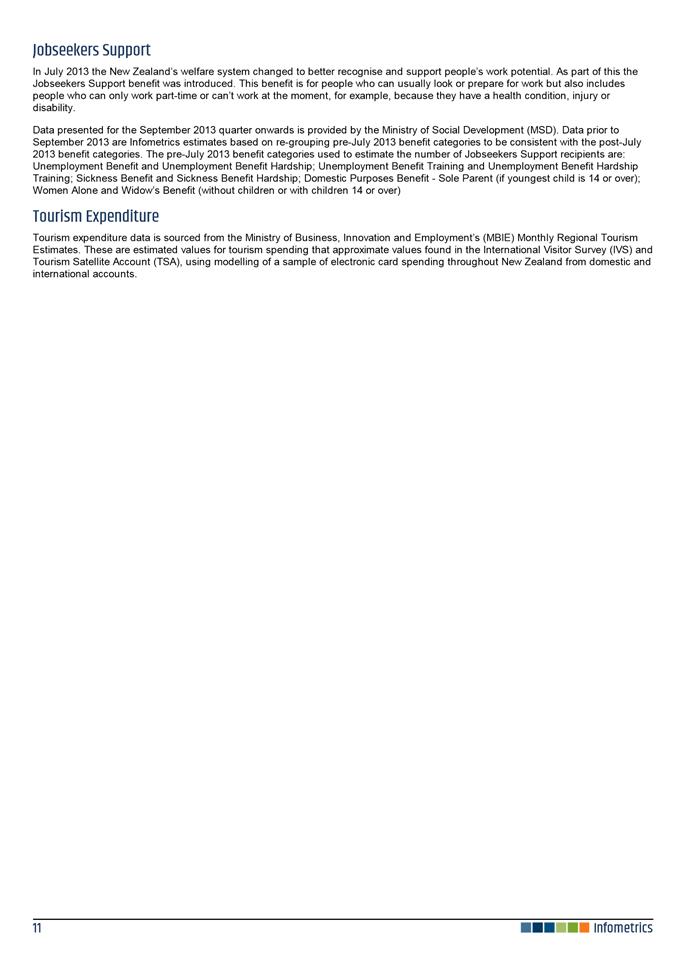
4.3 A list of projects is attached as Appendix 2.
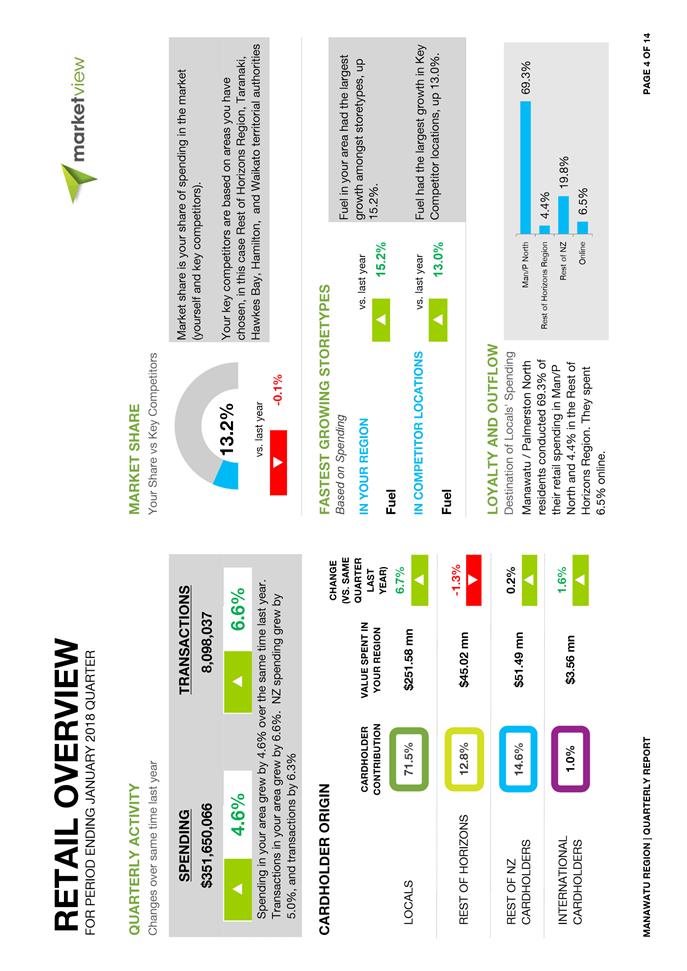
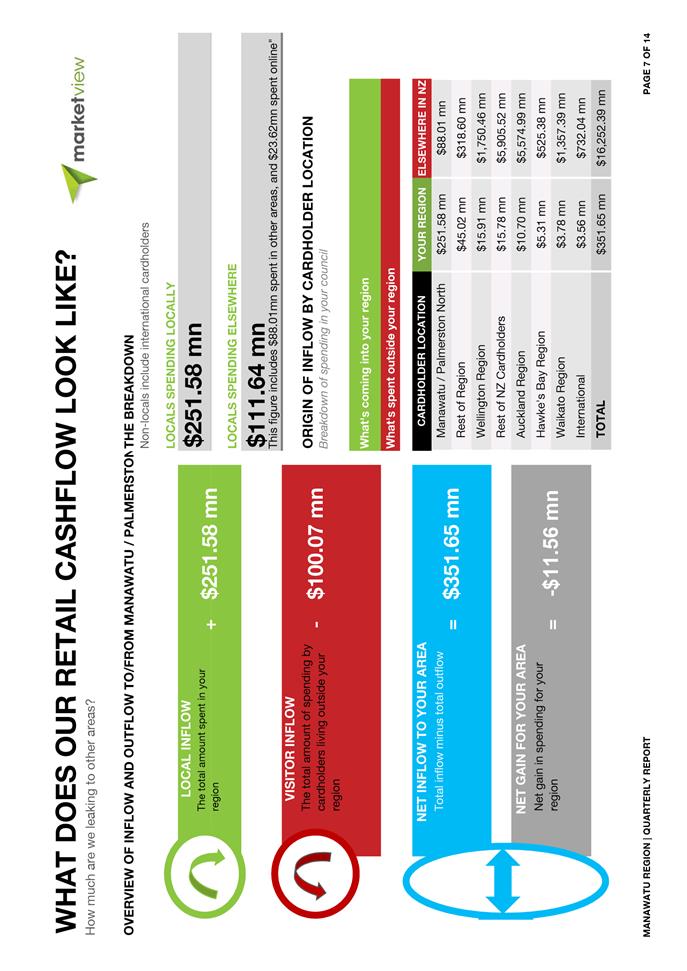
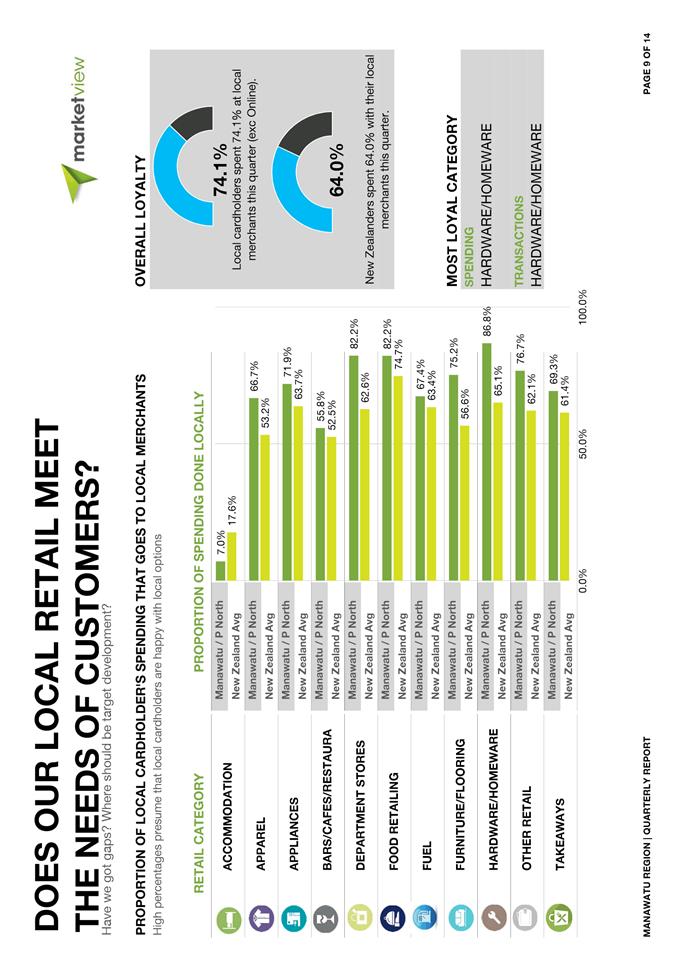
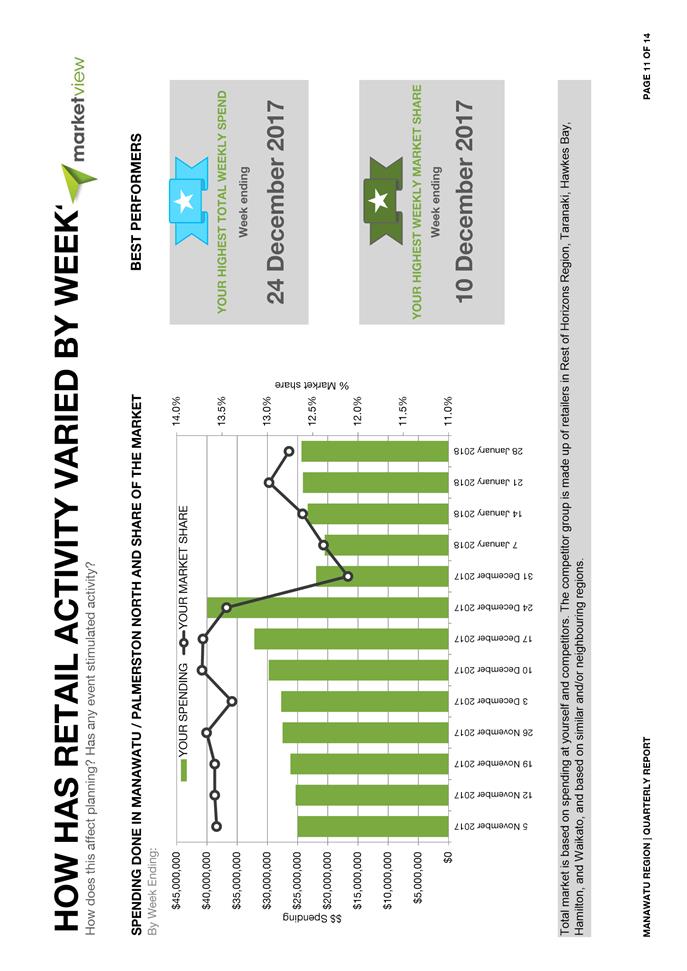
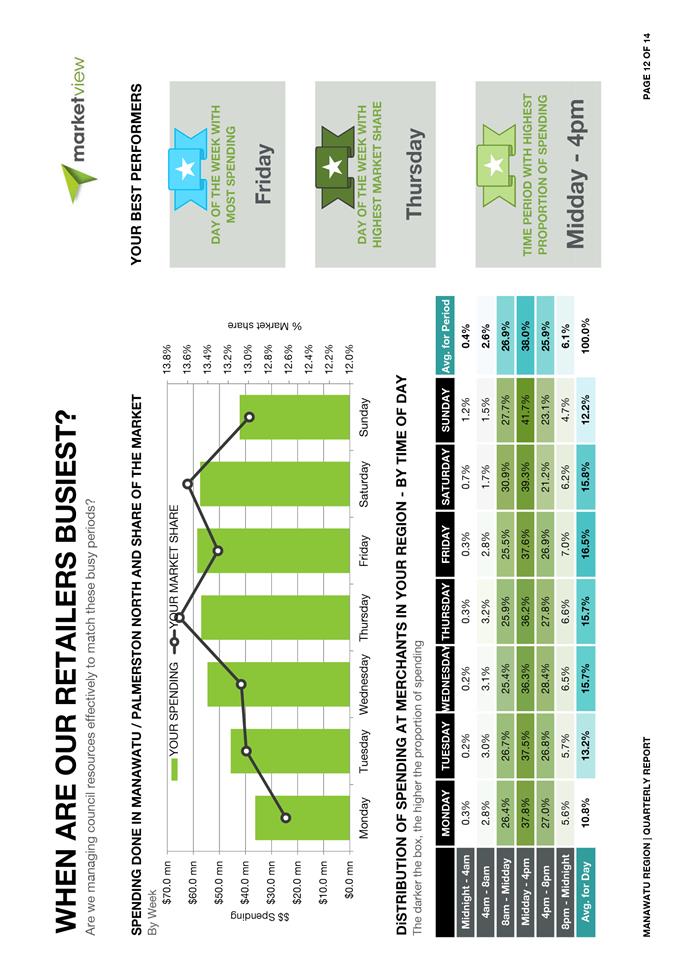
5. MANAWATŪ REGION QUARTERLY RETAIL REPORT FOR JANUARY 2018
5.1 The latest CEDA quarterly retail report for the three months ended
January 2018 shows a slowing in the rate of retail growth in the Manawatū
region from 5.7% in the three months ended October 2017 to 4.6% in the three
months ended January 2018. Growth in spending locally by local residents
improved from 5.3% in the three months ended October 2017 to 6.7% in the three
months ended February 2018.
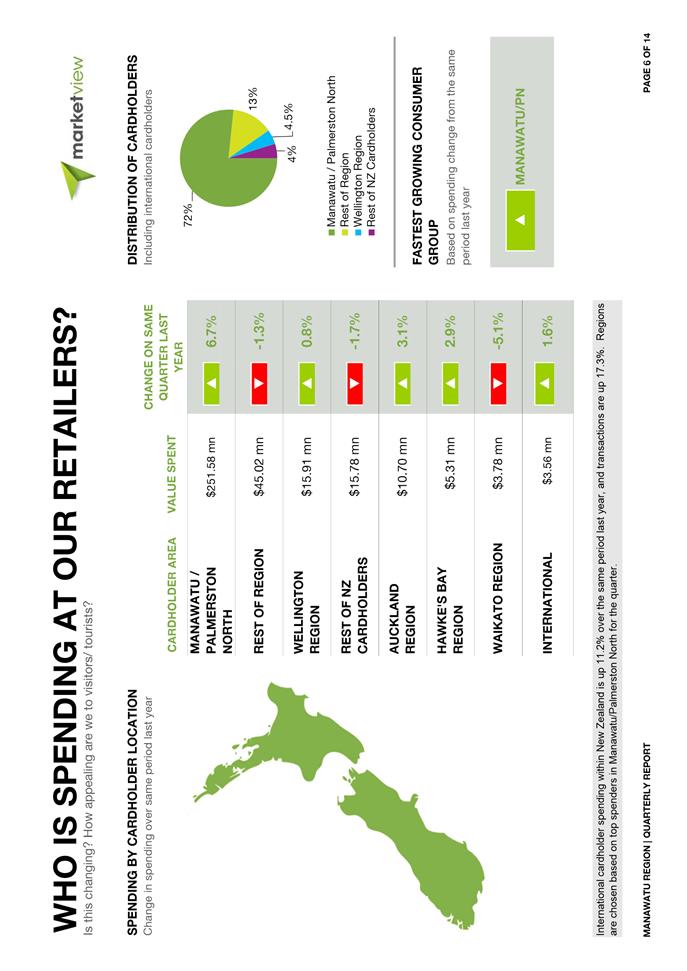
5.2 There
was a small decline in domestic visitor spending in the region in the latest
period but that followed strong growth in spending in the same period last
year. In the three months to January 2017 there was a 20.3% increase from
the Wellington region (partly due to the impact of the Kaikoura earthquake), a
17.3% increase from Auckland (in response to the lift in passenger numbers from
Jetstar) and a 12.5% increase from the Hawkes Bay.
5.3 Visitor
spending from the rest of the Horizons region declined by 1.3% in the three
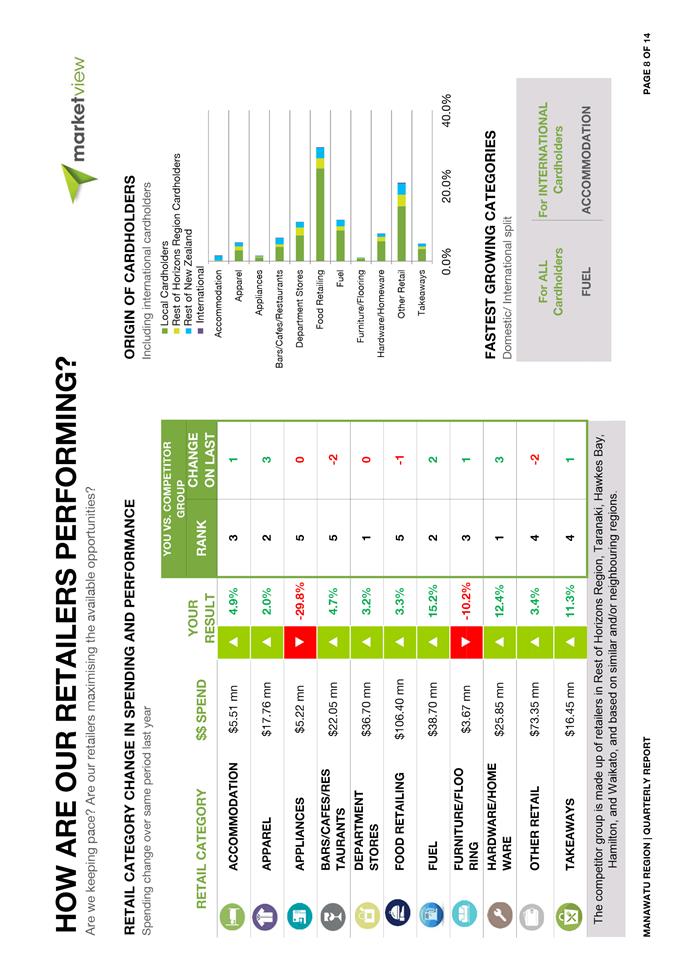
months ended January 2018. Food retailing across the Horizons region
(excluding Horowhenua) rose by 4.9% in the three months ended January but
increased by just 2.5% in Palmerston North. This is likely to be due to
higher rates of population growth in other councils in the region compared with
Palmerston North, but does also suggest that more supermarket purchases are
being made locally and less non-resident purchases are being made at City food
retailers.
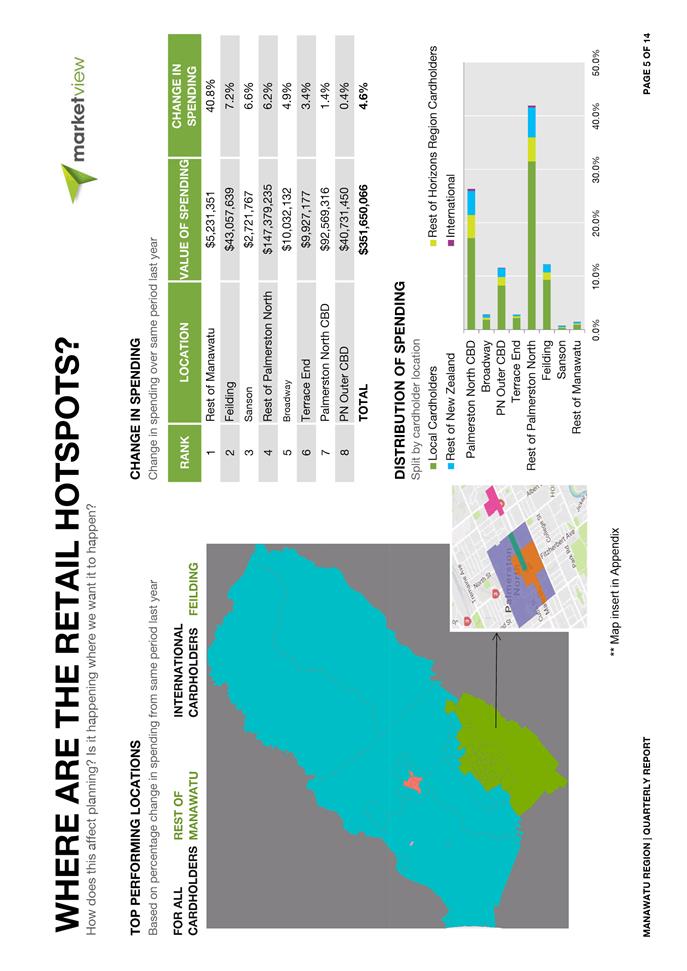
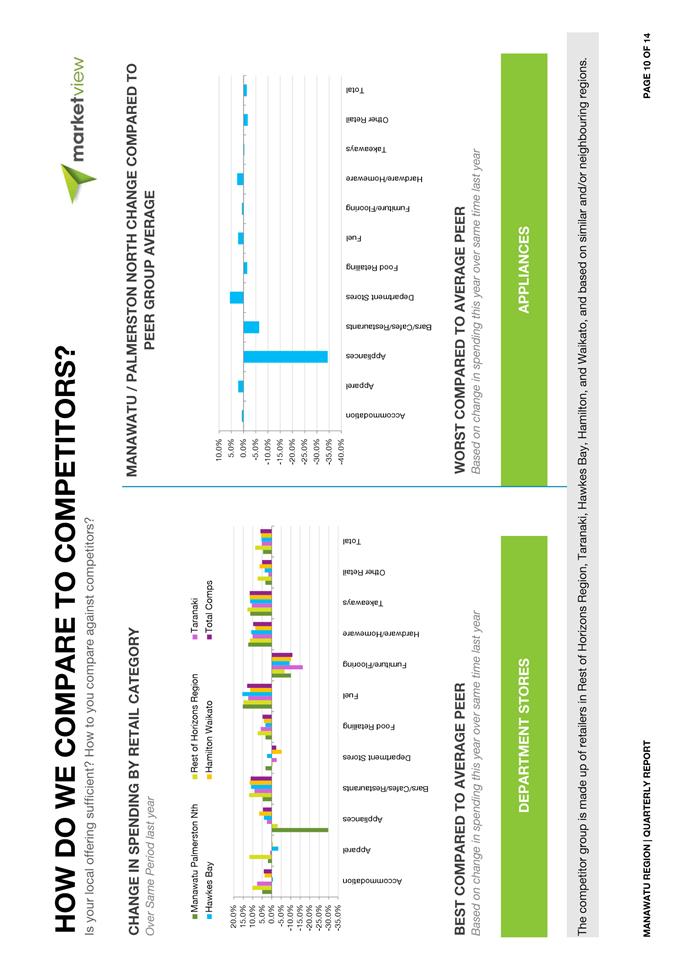
5.4 Retail precinct data shows a slowing in the rate of growth in
Broadway and weak growth in the rest of Palmerston North CBD. The rate of
growth in spending has increased in Manawatū District, with a 7.2%
increase in Feilding in the three months to January.
5.5 A copy of the report is attached as Appendix 3.
6. Compliance
and administration
|
Does the
Committee have delegated authority to decide?
If Yes quote
relevant clause(s) from Delegations Manual <Enter clause>
|
No
|
|
Are the
decisions significant?
|
No
|
|
If they are
significant do they affect land or a body of water?
|
No
|
|
Can this
decision only be made through a 10 Year Plan?
|
No
|
|
Does this
decision require consultation through the Special Consultative procedure?
|
No
|
|
Is there
funding in the current Annual Plan for these actions?
|
No
|
|
Are the
recommendations inconsistent with any of Council’s policies or plans?
|
No
|
Attachments
|
1.
|
Manawatū Quarterly Economic Monitor
December 2017 quarter ⇩ 
|
|
|
2.
|
Major Construction Projects 2018 - 2030 ⇩ 
|
|
|
3.
|
Quarterly Manawatū Region Retail
Report (January 2018) ⇩ 
|
|
|
Peter Crawford
Economic Policy Advisor
|
Linda Stewart
Chief Executive, CEDA
|
|