|
Grant
Smith (Mayor)
|
|
Debi
Marshall-Lobb (Deputy Mayor)
|
|
Mark
Arnott
|
Leonie
Hapeta
|
|
Brent
Barrett
|
Lorna
Johnson
|
|
Rachel
Bowen
|
Billy
Meehan
|
|
Vaughan
Dennison
|
Orphée
Mickalad
|
|
Lew
Findlay (QSM)
|
Karen
Naylor
|
|
Roly
Fitzgerald
|
William
Wood
|
|
Patrick
Handcock (ONZM)
|
Kaydee
Zabelin
|
Council MEETING
25 June 2025
Order of Business
1. Karakia
Timatanga
2. Apologies
3. Notification
of Additional Items
Pursuant to
Sections 46A(7) and 46A(7A) of the Local Government Official Information and
Meetings Act 1987, to receive the Chairperson’s explanation that
specified item(s), which do not appear on the Agenda of this meeting and/or the
meeting to be held with the public excluded, will be discussed.
Any
additions in accordance with Section 46A(7) must be approved by resolution with
an explanation as to why they cannot be delayed until a future meeting.
Any
additions in accordance with Section 46A(7A) may be received or referred to a
subsequent meeting for further discussion. No resolution, decision or
recommendation can be made in respect of a minor item.
4. Declarations
of Interest (if any)
Members
are reminded of their duty to give a general notice of any interest of items to
be considered on this agenda and the need to declare these interests.
5. Public
Comment
To receive
comments from members of the public on matters specified on this Agenda or, if
time permits, on other matters.
6. Tribute
- King's Birthday Honours 2025 Page 7
Presentation, by Deputy Mayor, Debi Marshall-Lobb
7. Confirmation
of Minutes Page 13
That the minutes of the ordinary Council meeting of 4 June
2025 Part I Public be confirmed as a true and correct record.
8. Notice
of Motion: Inclusion of the city centre in the scope of the draft Speed
Management Plan Page 31
Reports
9. Kākātangiata
Urban Growth Area: Update and Next Steps Page 39
Report, presented by Jono Ferguson-Pye, Manager City
Planning, Stewart McKenzie, Consultant Planning Advisor.
10. 21 Havelock Avenue,
Bill Brown Park: Proposal to grant a lease on Council land to Kia Toa Football
Club Incorporated - Deliberations Report Page 65
Memorandum, presented by Glenn Bunny, Manager Property
and Perene Green, Property Officer.
11. Public
Participation and Engagement: Annual Progress Report, and proposed indicators. Page 73
Memorandum, presented by Olivia Wix - Manager
Communications.
12. Palmerston North
Quarterly Economic Update - June 2025 Page 127
Memorandum, presented by Stacey Andrews, City
Economist.
13. Support of Remits
to Local Government New Zealand 2025 Annual General Meeting Page 149
Memorandum, presented by Sarah Claridge, Governance
Advisor.
14. Council Work
Schedule Page 161
15. Karakia
Whakamutunga
16. Exclusion of Public
|
|
To be moved:
That the public be excluded from the following parts
of the proceedings of this meeting listed in the table below.
The general subject of each matter to be considered
while the public is excluded, the reason for passing this resolution in
relation to each matter, and the specific grounds under Section 48(1) of the
Local Government Official Information and Meetings Act 1987 for the passing
of this resolution are as follows:
|
General subject of each matter to be considered
|
Reason for passing this resolution in
relation to each matter
|
Ground(s) under Section 48(1) for
passing this resolution
|
|
17.
|
Confirmation of the minutes of the ordinary
Council meeting of 4 June 2025 Part II Confidential
|
For the reasons set out in the Council of 4 June
2025, held in public.
|
|
18.
|
Purchase of land for City East Bore –
alteration of purchase price.
|
COMMERCIAL ACTIVITIES: This information needs to
be kept confidential to allow Council to engage in commercial activities
without prejudice or disadvantage
|
s7(2)(h)
|
|
19.
|
Mechanical Electrical Maintenance Contract -
revision
|
NEGOTIATIONS: This information needs to be kept confidential
to ensure that Council can negotiate effectively, especially in business
dealings
|
s7(2)(i)
|
This resolution is made in reliance on Section
48(1)(a) of the Local Government Official Information and Meetings Act 1987
and the particular interest or interests protected by Section 6 or Section 7
of that Act which would be prejudiced by the holding of the whole or the
relevant part of the proceedings of the meeting in public as stated in the
above table.
|
TRibute
TO: Council
MEETING DATE: 25
June 2025
TITLE: Tribute
- King's Birthday Honours 2025
RECOMMENDATION(S)
TO Council
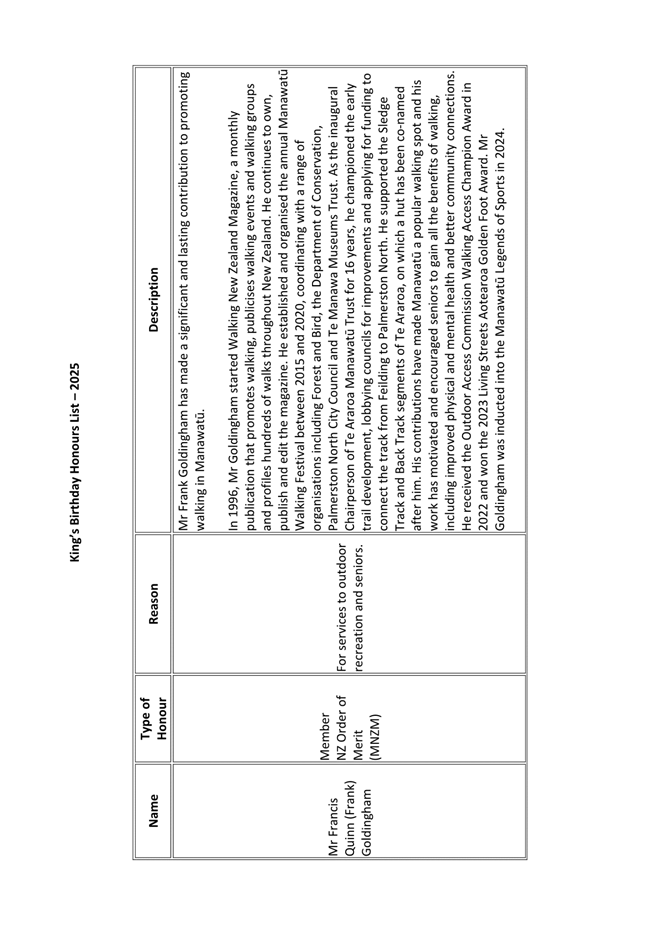
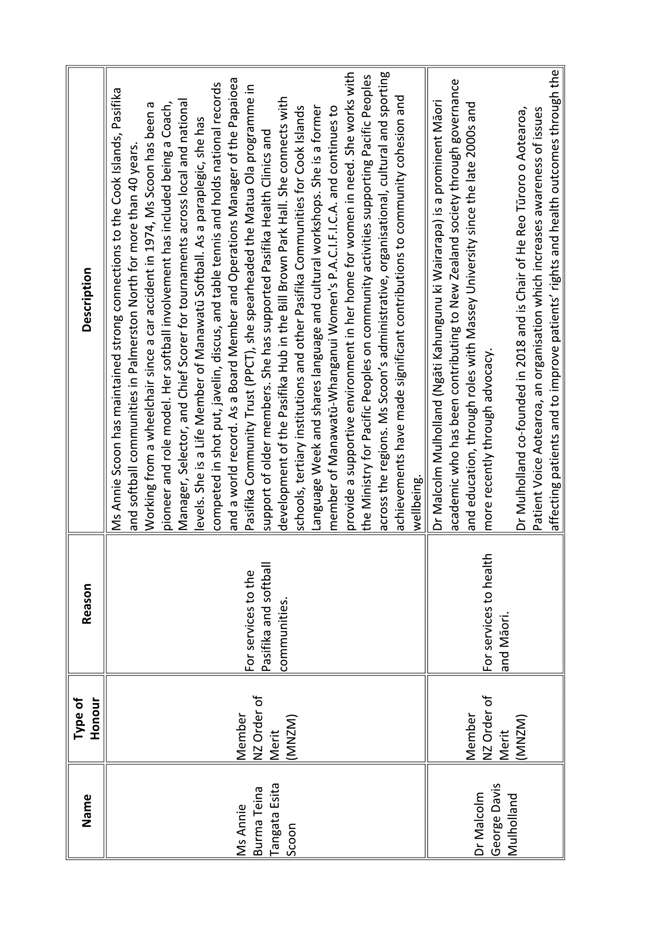
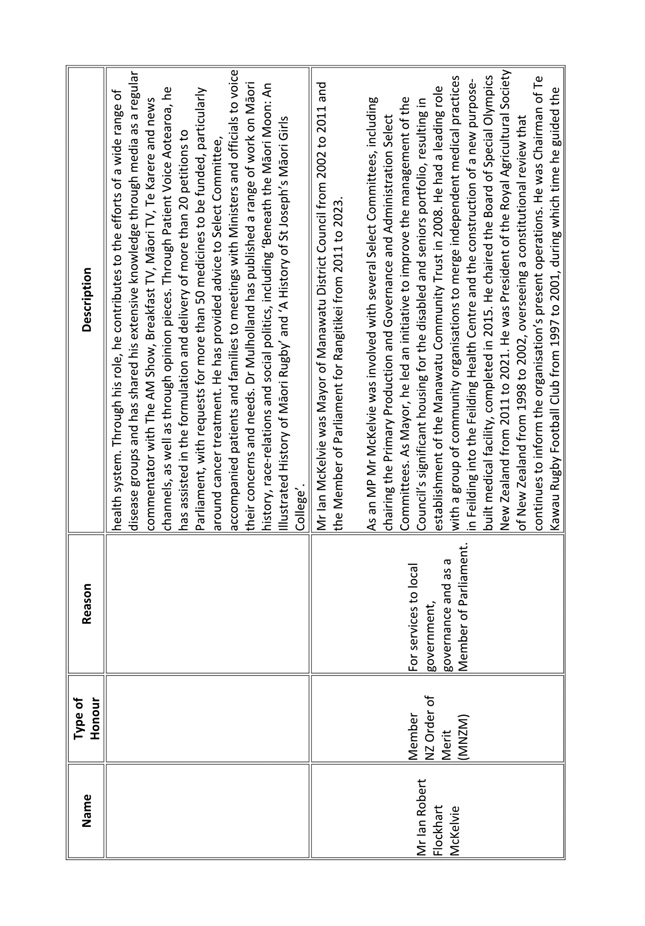
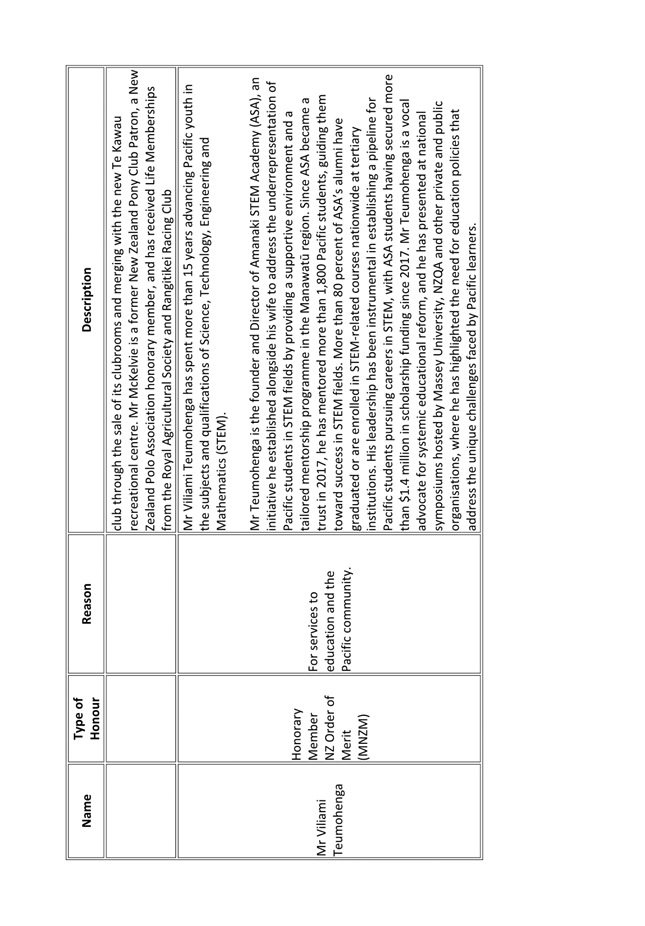
1. That Council
congratulate the local recipients of the King’s Birthday Honours 2025.
Deputy Mayor, Debi Marshall-Lobb will acknowledge the
achievements of the local recipients of the King’s Birthday Honours 2025.
Attachments
|
1.
|
King's
Birthday Honours ⇩ 
|
|
Palmerston North City Council
Minutes of
the Council Meeting Part I Public, held in the Council Chamber, First Floor,
Civic Administration Building, 32 The Square, Palmerston North on 04 June 2025,
commencing at 9.02am
|
Members
Present:
|
Grant Smith (The Mayor) (in the Chair)
and Councillors Debi Marshall-Lobb, Mark Arnott, Brent Barrett, Rachel Bowen,
Vaughan Dennison, Lew Findlay, Leonie Hapeta, Lorna Johnson, Billy Meehan,
Orphée Mickalad, Karen Naylor, William Wood and Kaydee Zabelin.
|
|
Members Present
Online:
|
Councillor Patrick Handcock
|
|
Apologies:
|
Councillor Roly Fitzgerald
|
Councillor William Wood left the meeting at 3.57pm after
consideration of clause 94-25. He entered the
meeting again in Part II Confidential at 3.02pm.
He was not present for clause 95-25.
|
|
Karakia
Timatanga
|
|
|
Councillor
Debi Marshall-Lobb opened the meeting with karakia.
|
|
81-25
|
Apologies
|
|
|
Moved Grant Smith, seconded Debi Marshall-Lobb.
RESOLVED
1. That
Council receive the apologies.
|
|
|
Clause 81-25 above was carried 15 votes to 0, the voting being as
follows:
For:
The Mayor (Grant Smith) and Councillors Debi Marshall-Lobb, Mark
Arnott, Brent Barrett, Rachel Bowen, Vaughan Dennison, Lew Findlay, Patrick
Handcock, Leonie Hapeta, Lorna Johnson, Billy Meehan, Orphée Mickalad,
Karen Naylor, William Wood and Kaydee Zabelin.
|
|
|
Declaration
of Interest
|
|
|
Councillor Debi Marshall-Lobb declared a conflict of
interest in Item 8 Notice of Motion: Palmerston North Boys High School -
Hockey Turf Project (clause 80-25) and took no further part in discussion or
debate.
|
|
82-25
|
Confirmation
of Minutes
|
|
|
Moved
Grant Smith, seconded Debi Marshall-Lobb.
RESOLVED
That the minutes of the ordinary Council meeting of 7 May
2025 Part I Public and Part II Confidential be confirmed as a true and
correct record.
|
|
|
Clause 82-25 above was
carried 15 votes to 0, the voting being as follows:
For:
The Mayor (Grant Smith) and
Councillors Debi Marshall-Lobb, Mark Arnott, Brent Barrett, Rachel Bowen,
Vaughan Dennison, Lew Findlay, Patrick Handcock, Leonie Hapeta, Lorna
Johnson, Billy Meehan, Orphée Mickalad, Karen Naylor, William Wood and
Kaydee Zabelin.
|
|
83-25
|
Confirmation
of Minutes
|
|
|
Moved
Grant Smith, seconded Debi Marshall-Lobb.
RESOLVED
That the minutes of the ordinary Council meeting of 14 May
2025 Part I Public be confirmed as a true and correct record.
|
|
|
Clause 83-25 above was
carried 15 votes to 0, the voting being as follows:
For:
The Mayor (Grant Smith) and
Councillors Debi Marshall-Lobb, Mark Arnott, Brent Barrett, Rachel Bowen,
Vaughan Dennison, Lew Findlay, Patrick Handcock, Leonie Hapeta, Lorna
Johnson, Billy Meehan, Orphée Mickalad, Karen Naylor, William Wood and
Kaydee Zabelin.
|
|
84-25
|
Notice
of Motion: Palmerston North Boys High School - Hockey Turf Project.
Councillor
Wood introduced the Notice of Motion.
|
|
|
Moved
William Wood, seconded Grant Smith.
RESOLVED
1. That
Council create a new operating programme to provide civic support for the
PNBHS Hockey Turf project of $33.5K in 2025/26 and refer $33.5K per year to
2026/27 and 2027/28 annual budget processes.
|
|
|
Clause 84-25 above was
carried 11 votes to 3, the voting being as follows:
For:
The Mayor (Grant Smith) and
Councillors Mark Arnott, Rachel Bowen, Vaughan Dennison, Lew Findlay, Patrick
Handcock, Leonie Hapeta, Lorna Johnson, Billy Meehan, Orphée Mickalad
and William Wood.
Against:
Councillors Brent Barrett,
Karen Naylor and Kaydee Zabelin.
Note
Councillor Debi
Marshall-Lobb declared a conflict of interest, withdrew from the
discussion and sat in the gallery.
|
|
85-25
|
Community
Committee Part I Public - 21 May 2025
Councillor Johnson presented the
recommendations below. She moved an additional motion, to agree Niuvaka Trust
as a Sector lead from 2025-2028. This was the recommendation that was laid on
the table from the Community Committee on 21 May 2025. The motion was lifted
and moved as the engagement required with the Pasifika community had
occurred.
|
|
|
Moved Lorna Johnson, seconded Patrick Handcock.
RESOLVED
1. That
Council adopt the recommendations from the Community Committee of 21 May
2025:
Potential locations for a public toilet
at Albert St (clause 12-25)
Memorandum, presented by Bill Carswell, Activities
Manager, Property Services.
1. That Council proceed with applying for a planning and building
consent for the installation of a single pan toilet at the end of Albert Street
(option 2 residential pump station).
|
|
|
Clause 85-25 above was
carried 12 votes to 1, with 2 abstentions, the voting being as follows:
For:
Councillors Debi
Marshall-Lobb, Brent Barrett, Rachel Bowen, Vaughan Dennison, Lew Findlay,
Patrick Handcock, Lorna Johnson, Billy Meehan, Orphée Mickalad, Karen
Naylor, William Wood and Kaydee Zabelin.
Against:
Councillor Mark Arnott.
Abstained:
The Mayor (Grant Smith) and Councillor Leonie
Hapeta.
|
|
|
|
Moved
Lorna Johnson, seconded Patrick Handcock.
RESOLVED
2. That
Council adopt the recommendations from the Community Committee of 21 May
2025:
Recommendation to engage Sector Lead Organisations (clause
11-25)
Memorandum, presented by Ahmed Obaid, Community
Development Advisor and Stephanie Velvin, Manager Community Development.
1. That Council
engage the following organisation through Sector Lead Partnership Agreement
for the period 1 July 2025 to 30 June 2028:
a. MASH Trust
|
|
|
|
Clause 85-25 above was
carried 14 votes to 0, with 1 abstention, the voting being as follows:
For:
The Mayor (Grant Smith) and
Councillors Debi Marshall-Lobb, Mark Arnott, Brent Barrett, Rachel Bowen,
Vaughan Dennison, Lew Findlay, Patrick Handcock, Lorna Johnson, Billy Meehan,
Orphée Mickalad, Karen Naylor, William Wood and Kaydee Zabelin.
Abstained:
Councillor Leonie Hapeta.
|
|
|
|
Moved
Lorna Johnson, seconded Patrick Handcock.
On a procedural motion:
That Council lift 1.b (make the Niuvaka Trust a sector lead for the period 1
July 2025- 30 June 2028) off the table.
The procedural motion was
carried 13 votes to 1, with 1 abstention, the voting being as follows:
For:
The Mayor (Grant Smith) and
Councillors Debi Marshall-Lobb, Mark Arnott, Brent Barrett, Rachel Bowen,
Vaughan Dennison, Lew Findlay, Patrick Handcock, Lorna Johnson, Billy Meehan,
Orphée Mickalad, William Wood and Kaydee Zabelin.
Against:
Councillor Karen Naylor.
Abstained:
Councillor Leonie Hapeta.
|
|
|
|
Moved
Lorna Johnson, seconded Patrick Handcock.
RESOLVED
2. That Council engage the
following organisation through Sector Lead Partnership Agreement for the
period 1 July 2025 to 30 June 2028:
b. Niuvaka Trust
|
|
|
|
Clause 85-25 above was
carried 13 votes to 1, with 1 abstention, the voting being as follows:
For:
The Mayor (Grant Smith) and
Councillors Debi Marshall-Lobb, Mark Arnott, Brent Barrett, Rachel Bowen,
Vaughan Dennison, Lew Findlay, Patrick Handcock, Lorna Johnson, Billy Meehan,
Orphée Mickalad, William Wood and Kaydee Zabelin.
Against:
Councillor Karen Naylor.
Abstained:
Councillor Leonie Hapeta.
|
|
|
86-25
|
Fees
and Charges - Confirmation following consultation
Memorandum, presented by
Steve Paterson, Manager - Financial Strategy.
Councillor Wood moved an
additional motion seeking information on how fees and charges for Planning
Services are set.
|
|
|
Moved Grant Smith, seconded Vaughan Dennison.
RESOLVED
2. That Council approve the fees and charges for Planning
& Miscellaneous Services, as scheduled in Attachments 2 and 3, effective
from 1 July 2025.
|
|
|
Clause 86-25 above was
carried 11 votes to 4, the voting being as follows:
For:
The Mayor (Grant Smith) and
Councillors Debi Marshall-Lobb, Brent Barrett, Rachel Bowen, Lew Findlay,
Patrick Handcock, Lorna Johnson, Billy Meehan, Orphée Mickalad, Karen
Naylor and Kaydee Zabelin.
Against:
Councillors Mark Arnott,
Vaughan Dennison, Leonie Hapeta and William Wood.
|
|
|
Moved
Grant Smith, seconded Vaughan Dennison.
RESOLVED
1. That Council receive the submissions for fees and
charges (Attachment 1).
3. That Council approve the fees and charges for
Trade Waste Services, as scheduled in Attachment 4, effective from 1 July
2025.
|
|
|
Clause 86-25 above was
carried 15 votes to 0, the voting being as follows:
For:
The Mayor (Grant Smith) and
Councillors Debi Marshall-Lobb, Mark Arnott, Brent Barrett, Rachel Bowen,
Vaughan Dennison, Lew Findlay, Patrick Handcock, Leonie Hapeta, Lorna
Johnson, Billy Meehan, Orphée Mickalad, Karen Naylor, William Wood and
Kaydee Zabelin.
|
|
|
Moved
William Wood, seconded Karen Naylor.
RESOLVED
4. That the Chief Executive
provide a breakdown for how we set our fees and charges for Planning
Services.
|
|
|
Clause 86-25 above was
carried 9 votes to 6, the voting being as follows:
For:
Councillors Mark Arnott,
Brent Barrett, Vaughan Dennison, Leonie Hapeta, Billy Meehan, Orphée
Mickalad, Karen Naylor, William Wood and Kaydee Zabelin.
Against:
The Mayor (Grant Smith) and
Councillors Debi Marshall-Lobb, Rachel Bowen, Lew Findlay, Patrick Handcock
and Lorna Johnson.
|
Meeting adjourned at 10.35am
Meeting resumed at 10.56am
|
87-25
|
2025/26
Annual Budget - Adoption
Memorandum, presented by Cameron
McKay, Chief Financial Officer, Steve Paterson, Manager - Financial Strategy
and Scott Mancer, Manager - Finance.
|
|
|
Moved
Grant Smith, seconded Debi Marshall-Lobb.
RESOLVED
1. That Council adopt the Annual Budget (Plan) for
2025/26 (as amended to incorporate item 8 (clause 84-25)) as attached.
2. That Council confirm the adoption of the Annual
Budget (Plan) 2025/26 is a significant decision within the parameters of the
Local Government Act 2002 and that Council is satisfied that all submissions
have been considered and that there has been compliance with the
decision-making and consultation requirements of the Act.
3. That Council delegate authority to the Chief
Executive to authorise payments to council-controlled organisations and other
external organisations in accordance with their respective service level
agreements.
|
|
|
Clause 87-25 above was
carried 11 votes to 4, the voting being as follows:
For:
The Mayor (Grant Smith) and
Councillors Debi Marshall-Lobb, Brent Barrett, Rachel Bowen, Vaughan
Dennison, Lew Findlay, Patrick Handcock, Leonie Hapeta, Lorna Johnson,
Orphée Mickalad and Kaydee Zabelin.
Against:
Councillors Mark Arnott,
Billy Meehan, Karen Naylor and William Wood.
|
|
88-25
|
Setting
Rates for 2025/26
Memorandum, presented by
Steve Paterson, Manager - Financial Strategy.
The agreed Rates resolution
2025-26 is attached.
|
|
|
Moved
Grant Smith, seconded Debi Marshall-Lobb.
RESOLVED
1. That Council
adopt the resolution to set the rates for the 2025/26 year (Attachment 1).
2. That Council
note that the setting of rates is a significant decision within the
parameters of the Local Government Act 2002 and that it is satisfied there
has been compliance with the decision-making and consultation requirements of
the Act.
|
|
|
Clause 88-25 above was
carried 12 votes to 3, the voting being as follows:
For:
The Mayor (Grant Smith) and
Councillors Debi Marshall-Lobb, Brent Barrett, Rachel Bowen, Vaughan Dennison,
Lew Findlay, Patrick Handcock, Leonie Hapeta, Lorna Johnson, Billy Meehan,
Orphée Mickalad and Kaydee Zabelin.
Against:
Councillors Mark Arnott,
Karen Naylor and William Wood.
|
|
89-25
|
Resolutions
to Authorise Borrowing
Memorandum, presented by
Steve Paterson, Manager - Financial Strategy.
|
|
|
Moved
Grant Smith, seconded Debi Marshall-Lobb.
RESOLVED
1. That Council
authorise the Chief Executive to borrow, in accordance with delegated
authority, up to $49 million (“the Borrowing”) of additional term
debt by way of bank loan or loans or credit facilities or other facilities or
the issue of stock for the Borrowing secured by the Debenture Trust Deed.
2. That Council
note that the purpose of the Borrowing is the carrying out or continuing of
programmes identified in the 2025/26 Annual Budget.
3. That Council
note that any sums raised and subsequently on-lent to Palmerston North
Airport Limited pursuant to the loan agreement between the Council and the
Company will be in addition to the sums to be raised for the Council’s
own funding purposes as authorised above.
4. That Council
note that the security for the Borrowing may be the charge over rates under
the Debenture Trust Deed if the Chief Executive considers appropriate.
5. That Council
approve that having regard to the Council’s financial strategy, it is
prudent and reasonable to enter into the proposed borrowing for the reasons
set out in this report.
6. That Council
note that the raising of the Borrowing will comply with the Council's
Liability Management Policy.
7. That Council
note that the decision to borrow up to $49 million is a significant decision
within the parameters of the Local Government Act 2002 and is satisfied that
there has been compliance with the decision-making and consultation
requirements of the Act.
|
|
|
Clause 89-25 above was
carried 11 votes to 0, with 4 abstentions, the voting being as follows:
For:
The Mayor (Grant Smith) and
Councillors Debi Marshall-Lobb, Brent Barrett, Rachel Bowen, Vaughan Dennison,
Lew Findlay, Patrick Handcock, Leonie Hapeta, Lorna Johnson, Orphée
Mickalad and Kaydee Zabelin.
Abstained:
Councillors Mark Arnott,
Billy Meehan, Karen Naylor and William Wood.
|
Meeting adjourned at 12.16pm
Meeting resumed at 1.18pm
|
90-25
|
Local Water Done Well Decision
Report, presented by Mike
Monaghan, Manager Three Waters, Julie Keane, Transition Manager, Olivia Wix,
Manager Communications and Scott Mancer, Manager Finance.
Officers made a presentation
(as attached). They explained that there was an error in workshop material
from last week where the inflated figures for the Palmerston North City
Council base case had been shown. This has been corrected in the report to
show the uninflated figures over the 10 year period.
Officers corrected the
following additional errors in the report:
In section 11.9 of the report
(page 96), the additional debt repayment provisions of $75M
should read $150M in the Long-Term Plan.
Figures in the Palmerston
North City Council base case throughout the report include the cost of
the IFF levy (for Nature Calls).
Page 83 –
Financial Section for Option 3 (for a standalone Council-Controlled
Organisation) - The figure for 10 years should read $2790 per year not 3,800
per year.
|
|
|
Moved
Grant Smith, seconded Debi Marshall-Lobb.
RESOLVED
1. That
this matter or decision is recognised as of high significance in accordance
with the Council’s Significance and Engagement Policy.
|
|
|
Clause 90-25 above was
carried 15 votes to 0, the voting being as follows:
For:
The Mayor (Grant Smith) and
Councillors Debi Marshall-Lobb, Mark Arnott, Brent Barrett, Rachel Bowen,
Vaughan Dennison, Lew Findlay, Patrick Handcock, Leonie Hapeta, Lorna
Johnson, Billy Meehan, Orphée Mickalad, Karen Naylor, William Wood and
Kaydee Zabelin.
|
|
|
Moved
Grant Smith, seconded Debi Marshall-Lobb.
RESOLVED
2. That
Council confirm a Joint Water Services Council-Controlled Organisation as its
preferred future Water Services Delivery Model.
3. That
Council agree to partner with Horowhenua District Council and Rangitīkei
District Council in a Joint Water Services Council-Controlled Organisation
(WSCCO).
4. That
Council agree to continue to work with Ruapehu District Council and Whanganui
District Council with a view to including them in a Joint WSCCO upon
confirmation from those councils.
5. That
Council instruct the Chief Executive to prepare a Joint Water Services
Delivery Plan to be brought back to Council in August 2025 for approval prior
to submission to the Department of Internal Affairs before the 3 September
deadline, which includes further information relating to the management of
stormwater.
|
|
|
Clause 90-25 above was
carried 12 votes to 3, the voting being as follows:
For:
The Mayor (Grant Smith) and
Councillors Debi Marshall-Lobb, Mark Arnott, Rachel Bowen, Vaughan Dennison,
Lew Findlay, Patrick Handcock, Leonie Hapeta, Lorna Johnson, Billy Meehan,
Orphée Mickalad and William Wood.
Against:
Councillors Brent Barrett,
Karen Naylor and Kaydee Zabelin.
|
|
91-25
|
Te
Motu o Poutoa Governance and Management Structure Options: Summary of
submissions, including hearings
Report, presented by Kathy
Dever-Tod, Manager Parks and Reserves
Cameron McKay, General Manager, Corporate Services.
|
|
|
Moved
Grant Smith, seconded Debi Marshall-Lobb.
RESOLVED
1. That Council agree to the establishment of a
Jointly Governed Council-Controlled Organisation, governed by Council and
Rangitāne o Manawatū for the Te Motu o Poutoa civic marae and
cultural centre, subject to Council confirming ongoing funding in the 2025/26
Annual Plan.
2. That Council note the following steps are required
before the new Jointly Governed Council Controlled Organisation commences
operations:
· Proposed establishment costs and
processes, including relevant entity agreements such as a shareholders
agreement or trust deed.
· A Statement of Expectation agreed by
Council
· A Statement of Intent agreed upon between the
Board and the Shareholders, outlining the specific objectives, clear roles
and responsibilities for the Council-Controlled Organisation, including
Council and Rangitāne o Manawatū roles in monitoring and
accountability
· Appointment of Board members
|
|
|
Clause 91-25 above was
carried 14 votes to 1, the voting being as follows:
For:
The Mayor (Grant Smith) and
Councillors Debi Marshall-Lobb, Brent Barrett, Rachel Bowen, Vaughan
Dennison, Lew Findlay, Patrick Handcock, Leonie Hapeta, Lorna Johnson, Billy
Meehan, Orphée Mickalad, Karen Naylor, William Wood and Kaydee
Zabelin.
Against:
Councillor Mark Arnott.
|
|
92-25
|
Council
Work Schedule
|
|
|
Moved
Grant Smith, seconded Debi Marshall-Lobb.
RESOLVED
1. That Council receive its Work Schedule dated 4
June 2025.
|
|
|
Clause 92-25 above was
carried 15 votes to 0, the voting being as follows:
For:
The Mayor (Grant Smith) and
Councillors Debi Marshall-Lobb, Mark Arnott, Brent Barrett, Rachel Bowen,
Vaughan Dennison, Lew Findlay, Patrick Handcock, Leonie Hapeta, Lorna Johnson,
Billy Meehan, Orphée Mickalad, Karen Naylor, William Wood and Kaydee
Zabelin.
|
Recommendations from Committee Meetings
|
93-25
|
Strategy
& Finance Committee Part I Public - 28 May 2025
Councillor Vaughan Dennison presented the
recommendations below:
|
|
|
Moved
Vaughan Dennison, seconded Karen Naylor.
RESOLVED
1. That Council adopt the
recommendations from the Strategy & Finance Committee of 28 May 2025:
Variable Speed Limits for schools - confirmation of
scope for draft Speed Management Plan (clause 17-25)
Memorandum, presented by
Peter Ridge, Senior Policy Analyst and James Miguel, Senior Transport
Planner.
1. That Council
confirm that the scope of the draft Speed Management Plan 2025 (stage 1) will
include:
· variable speed limits for all schools within
Palmerston North; and
· Te Wanaka Road/SH56 intersection; and
· An intersection speed zone (ISZ) for Longburn- Rongotea Road/No. 1
Line.
|
|
|
|
Clause 93-25 above was
carried 14 votes to 1, the voting being as follows:
For:
The Mayor (Grant Smith) and
Councillors Debi Marshall-Lobb, Mark Arnott, Brent Barrett, Rachel Bowen,
Vaughan Dennison, Lew Findlay, Patrick Handcock, Lorna Johnson, Billy Meehan,
Orphée Mickalad, Karen Naylor, William Wood and Kaydee Zabelin.
Against:
Councillor Leonie Hapeta.
|
|
|
|
|
|
Exclusion
of Public
|
94-25
|
Recommendation to
Exclude Public
|
|
|
Moved Grant Smith, seconded Debi Marshall-Lobb.
RESOLVED
That the public be excluded from the following parts
of the proceedings of this meeting listed in the table below.
The general subject of each matter to be considered
while the public is excluded, the reason for passing this resolution in
relation to each matter, and the specific grounds under Section 48(1) of the
Local Government Official Information and Meetings Act 1987 for the passing
of this resolution are as follows:
|
General subject of each matter to be
considered
|
Reason for passing this resolution in
relation to each matter
|
Ground(s) under Section 48(1) for
passing this resolution
|
|
21.
|
Presentation of the Part II Confidential Strategy
& Finance Committee Recommendations from its 28 May 2025 Meeting
|
NEGOTIATIONS: This information needs to be kept confidential
to ensure that Council can negotiate effectively, especially in business
dealings
|
s7(2)(i)
|
|
|
|
|
This resolution is made in reliance on Section
48(1)(a) of the Local Government Official Information and Meetings Act 1987
and the particular interest or interests protected by Section 6 or Section 7
of that Act which would be prejudiced by the holding of the whole or the
relevant part of the proceedings of the meeting in public as stated in the
above table.
|
|
|
Clause 94-25 above was carried 15 votes to 0, the voting being as
follows:
For:
The Mayor (Grant Smith) and Councillors Debi Marshall-Lobb, Mark
Arnott, Brent Barrett, Rachel Bowen, Vaughan Dennison, Lew Findlay, Patrick
Handcock, Leonie Hapeta, Lorna Johnson, Billy Meehan, Orphée Mickalad,
Karen Naylor, William Wood and Kaydee Zabelin.
|
The public part
of the meeting finished at 2.57pm
Confirmed 25 June 2025
Mayor
Attachment One
Palmerston
North City Council
Resolution
to Set Rates for the 2025/2026 year
The Palmerston North City Council
resolves to set rates for the financial year commencing on 1 July 2025 and
ending on 30 June 2026 in accordance with the Rating Policies and Funding
Impact Statement contained in its Annual Budget (Plan) 2025/26 as follows:
1 Details
of rates to be set
Notes
· All
rates and charges shown are inclusive of Goods and Services Tax.
· References
to the ‘Act’ relate to the Local Government (Rating) Act 2002.
1.1 Uniform
Annual General Charge
A
Uniform Annual General Charge of $300 on each rating unit pursuant to section
15 of the Act.
1.2 General
Rate (based on land value)
A
general rate pursuant to section 13 of the Act set on all rateable land on the
basis of land value and assessed differentially (based on land use) against
each property group code at the rate of cents in the dollar set down in the
following schedule:
|
Differential Group
|
Differential
Factor
(expressed
as % of Group Code MS)
|
Rate
(cents in $
of LV)
|
|
Code
|
Brief Description
|
|
R1
|
Single
unit residential
|
Balance
(approx.80)
|
0.4134
|
|
R2
|
Two unit
residential
|
110
|
0.5697
|
|
R3
|
Three
unit residential
|
120
|
0.6215
|
|
R4
|
Four
unit residential
|
130
|
0.6733
|
|
R5
|
Five
unit residential
|
140
|
0.7251
|
|
R6
|
Six unit
residential
|
150
|
0.7769
|
|
R7
|
Seven
unit residential
|
160
|
0.8286
|
|
R8
|
Eight or
more unit residential
|
170
|
0.8804
|
|
MS
|
Miscellaneous
|
100
|
0.5179
|
|
CI
|
Non-residential
(Commercial/Industrial)
|
250
|
1.2948
|
|
FL
|
Rural
& Semi-serviced
(5
hectares or more)
|
25
|
0.1295
|
|
FS
|
Rural
& Semi-serviced
(0.2
hectares or less)
|
75
|
0.3884
|
|
FM
|
Rural
& Semi-serviced (between 0.2 & 5 hectares)
|
55
|
0.2848
|
1.3 Capital
Value targeted rate
A targeted rate to fund the costs of the
goal one (innovative and growing city) activities including transport, economic
development, housing and urban design, set under section 16 of the Act on all
rateable land on the basis of the capital value, and assessed differentially
(based on land use [1])
against each property group code at the rate of cents in the dollar set down in
the following schedule:
|
Differential Group
|
Differential Factor
(expressed as % of
Group Code MS)
|
Rate
(cents in $ of CV)
|
|
Code
|
Brief Description
|
|
R1
|
Single unit
residential
|
Balance (approx.
76)
|
0.1009
|
|
R2
|
Two unit
residential
|
120
|
0.1589
|
|
R3
|
Three unit
residential
|
120
|
0.1589
|
|
R4
|
Four unit
residential
|
120
|
0.1589
|
|
R5
|
Five unit
residential
|
120
|
0.1589
|
|
R6
|
Six unit residential
|
120
|
0.1589
|
|
R7
|
Seven unit
residential
|
120
|
0.1589
|
|
R8
|
Eight or more unit
residential
|
120
|
0.1589
|
|
MS
|
Miscellaneous
|
100
|
0.1324
|
|
CI
|
Non-residential
(Commercial/Industrial)
|
200
|
0.2648
|
|
FL
|
Rural/Semi-serviced
|
35
|
0.0463
|
|
(5 hectares or
more)
|
|
FS
|
Rural/Semi-serviced
|
75
|
0.0993
|
|
(0.2 hectares or
less)
|
|
FM
|
Rural/Semi-serviced
(between 0.2 & 5 hectares)
|
55
|
0.0728
|
1.4 Water Supply Rates
A
targeted rate for water supply, set under section 16 of the Act, of:
· $487
per separately used or inhabited part of a residential rating unit which is
connected to a Council operated waterworks system. This charge is not
made where water supply is invoiced on the basis of water consumed.
· $487
per rating unit for all other rating units which are connected to a Council
operated waterworks system. This charge is not made where water supply is
invoiced on the basis of water consumed.
· $243.50
per rating unit which is not connected to a Council operated waterworks system
but which is serviceable (i.e. within 100 metres of such waterworks system) and
the Council would allow a connection.
Instead of the above
targeted rates for metered water supply, targeted rates set under sections 16
and 19 of the Act, of $1.96305 per cubic metre of water supplied to any rating
unit that is invoiced on the basis of water supplied plus a fixed amount of
$253 per metered connection for connections of 25mm or less and $540 for
connections greater than 25mm.
1.5 Wastewater
Disposal Rates
A
targeted rate for wastewater disposal, set under section 16 of the Act, of:
· $397
per separately used or inhabited part of a residential rating unit which is
connected to a public wastewater drain.
· $397
per rating unit for all other rating units which are connected to a public
wastewater drain.
· $397
per pan (i.e. water closet or urinal) for all pans in excess of three for
non-residential rating units connected to a public wastewater drain.
· $198.50
per separately used or inhabited part of a residential rating unit which is not
connected to a public wastewater drain but which is serviceable (i.e. within 30
metres of such a drain) and the Council would allow the connection.
· $198.50
per rating unit for all other rating units which are not connected to a public
wastewater drain but which is serviceable (i.e. within 30 metres of such a
drain) and the Council would allow the connection.
1.6 Rubbish
and Recycling Rates
1.6.1 Kerbside Recycling
A
targeted rate for kerbside recycling set under section 16 of the Act of:
· $188 per separately
used or inhabited part of a rating unit for residential properties receiving
the Council’s kerbside collection service.
· $188 per rating unit
for non-residential and rural/semi-serviced properties receiving the
Council’s kerbside collection service.
Where
ratepayers elect, and the Council agrees, additional levels of service may be
provided. These additional services could be by way of provision of more
recycling bins or more frequent service. Each additional level of service
will be charged a rate of $188. This may include charges to non-rateable
rating units where the service is provided.
1.6.2 Rubbish and Public Recycling
A
targeted rate for rubbish and public recycling set under section 16 of the Act
of $69 per separately used or inhabited part of each residential rating unit
and $69 per rating unit for all other rating units. Rating units which
are vacant land will not be liable for these rates.
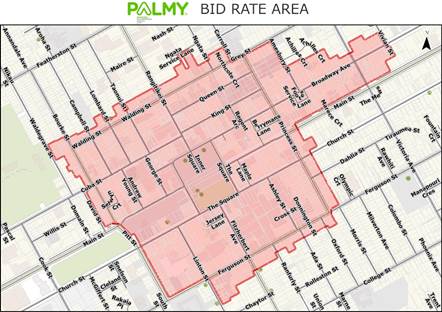
1.7 Palmy BID
Targeted
rates set under section 16 of the Act on all properties within the central city
Palmy BID area as shown on the following map that are categorised as
non-residential for the Council’s general rate calculated as follows:
· A fixed amount of
$345 per rating unit; and
· A variable amount of 0.0137 cents in
the dollar of capital value of the rating unit.
2. Due
Dates for Payment of Rates
Rates (other than metered water
targeted rates) will be payable at the offices or agencies of the Council in
four quarterly instalments on 1 August 2025, 1 November 2025, 1 February 2026
and 1 May 2026.
The due dates (i.e. final day for
payment without incurring penalty) shall be:
Instalment
One 29 August 2025
Instalment
Two 28 November
2025
Instalment
Three 27 February 2026
Instalment Four 29
May 2026
3. Due
Dates for Payment of Metered Water Targeted Rates
Properties which have water provided
through a metered supply will be invoiced either monthly or two monthly at the
discretion of the Council.
The due date for metered water
targeted rates shall be the 20th of the month following invoice date
as follows:
|
Monthly invoicing
|
|
Instalment
|
Date meter read &
invoice issued
|
Due date
|
Instalment
|
Date meter read &
invoice issued
|
Due date
|
|
1
2
3
4
5
6
|
June 2025
July 2025
August 2025
September 2025
October 2025
November 2025
|
20 July 2025
20 August 2025
20 September 2025
20 October 2025
20 November 2025
20 December 2025
|
7
8
9
10
11
12
|
December 2025
January 2026
February 2026
March 2026
April 2026
May 2026
|
20 January 2026
20 February 2026
20 March 2026
20 April 2026
20 May 2026
20 June 2026
|
|
Two monthly invoicing
|
|
Linton, East & North
Rounds
|
Ashhurst, South West,
PNCC & Central Rounds
|
|
Instalment
|
Date meter read &
invoice issued
|
Due date
|
Instalment
|
Date meter read &
invoice issued
|
Due date
|
|
1
2
3
4
5
6
|
June 2025
August 2025
October 2025
December 2025
February 2026
April 2026
|
20 July 2025
20 September 2025
20 November 2025
20 January 2026
20 March 2026
20 May 2026
|
1
2
3
4
5
6
|
July 2025
September 2025
November 2025
January 2026
March 2026
May 2026
|
20 August 2025
20 October 2025
20 December 2025
20 February 2026
20 April 2026
20 June 2026
|
4. Penalties
on Unpaid Rates (excluding metered water)
A penalty charge of 10% will be added
on the following dates to any portion of an instalment remaining unpaid after
the due dates:
Instalment
One 3 September
2025
Instalment
Two 3 December 2025
Instalment
Three 4 March 2026
Instalment Four 3
June 2026
Any penalty charge imposed on the
outstanding first instalment will be automatically remitted provided payment of
the full year’s rates is made by 28 November 2025.
A penalty charge of 10% will be added
to any outstanding rates (including penalties) assessed in previous years and
remaining outstanding at 3 July 2025 (penalty applied on 4 July 2025) and again
on 5 January 2026 (penalty applied on 6 January 2026).
Penalties will not be applied to the
metered water targeted rate.
4 June 2025
Notice of Motion
TO: Council
MEETING DATE: 25
June 2025
TITLE: Notice
of Motion: Inclusion of the city centre in the scope of the draft Speed
Management Plan
FROM: Councillor
Brent Barrett
THAT THE Council Resolves:
1. That Council
confirm that the scope of the draft Speed Management Plan 2025 (stage 1)
will include the city centre.
I, Brent Barrett, in accordance
with Standing Order 2.7.1. hereby GIVE NOTICE OF
MOTION that I will move at the
next Council meeting on 25 June 2025 the following
motion:
That Council confirm that the
scope of the draft Speed Management Plan 2025 (stage 1) will include the city
centre.
AND I further give notice that in
compliance with Standing Order 2.7.2 the reasons for the Notice of Motion
include:
Reviewing city centre speed limits
will deliver substantial benefits for the city centre as a desired destination,
enhance its live-work-play attractiveness, make it more pedestrian and bike
friendly, support city centre businesses, increase road safety, improve traffic
flow, and deliver cost-efficiencies; contributing directly to the performance
and potential of our city centre.
Only 12 elected members
participated in the initial decision on the member's recommendation at the
Strategy & Finance Committee meeting of 28 May 2025. The meeting was
divided with a 6 - 6 vote. Bringing this motion to full Council gives all
elected members the opportunity to
participate in the decision.
Noting that under Standing Order
2.25.1, "when a motion has been considered and rejected by the Council or
a committee, no similar notice of motion which, in the opinion of the
Chairperson, may be accepted within the next six months, unless signed by not
less than one third of all members, including vacancies. "
More than one third of elected
members have signed below to request that Council
reconsider the motion, which
failed for lack of majority at the Strategy and Finance
Committee meeting of 28 May 2025.
Moved Cr Brent Barrett
Seconded Mayor Grant Smith.
Attachments
|
1.
|
Officer's
Advice on Notice of Motion - Scope of Speed Management Plan ⇩ 
|
|
TO: Council
MEETING DATE: 25
June 2025
TITLE: Kākātangiata
Urban Growth Area: Update and Next Steps
PRESENTED BY: Jono
Ferguson-Pye, Manager City Planning, Stewart McKenzie, Consultant Planning
Advisor
APPROVED BY: David
Murphy, General Manager Strategic Planning
RECOMMENDATION(S)
TO Council
1. That the
Chief Executive prepare a District Plan change to zone the
Kākātangiata Residential Growth Area identified in Map 9.2 of the
Palmerston North City District Plan to Future Urban Zone (Option 4).
Summary of options analysis
|
Problem
or Opportunity
|
Kākātangiata
rezoning options
|
|
OPTION 1:
|
Rezone Kākātangiata to Residential using
existing resources and budget allocated in 2024/34 LTP (current approach).
|
|
Community Views
|
Will be heard through
the plan change submission and hearing process.
|
|
Benefits
|
Conventional and well
understood, uses existing technical inputs, is consistent with landowner and
developer expectations.
|
|
Risks
|
Complex process,
programme delay, landowner and developer frustration at not advancing land
supply in the medium term.
|
|
Financial
|
High costs borne by
ratepayers to date, existing budget not sufficient to fund process.
|
|
OPTION 2:
|
Rezone Kākātangiata to Residential with
increased budget 2025/26 -2026/27
|
|
Community Views
|
Will be heard through
the plan change submission and hearing process.
|
|
Benefits
|
Conventional and well
understood, uses existing technical inputs, consistent with landowner and
developer expectations, may deliver land supply in the medium term.
|
|
Risks
|
Complex process,
unlikely to resolve programme delay, landowner and developer frustration at
not advancing land supply over the medium term.
|
|
Financial
|
Higher costs borne by
ratepayers. Additional budget not provided in 2025/26 Annual Budget. Would
require reprioritizing existing work programme in 2025/26 and additional
budget in 2026/27. Reassess progress and budgets as part of 2027 LTP. This
option will require more budget in years 2 and 3 of the 2024 LTP than option
3.
|
|
OPTION 3:
|
Rezone
Kākātangiata to Residential with increased budget 2025/26 -2029/30
|
|
Community Views
|
Will be heard through
the plan change submission and hearing process.
|
|
Benefits
|
Conventional and well
understood, uses existing technical inputs, consistent with landowner and
developer expectations, delivers land supply in the medium term but over a
longer timeframe.
|
|
Risks
|
Complex process,
unlikely to resolve programme delay, landowner and developer frustration at
not advancing land supply over the medium term.
|
|
Financial
|
Higher costs borne by
ratepayers, but spread over longer timeframe. Additional budget not provided
in 2025/26 Annual Budget. Would require reprioritizing existing work
programme in 2025/26 and additional budget in 2026/27. Reassess progress and
budget as part of 2027 LTP. This option spreads the costs of a longer time
period than option 2.
|
|
OPTION 4:
|
Rezone
Kākātangiata to Future Urban Zone using existing budget allocations
for 2025/26 and 2026/27
|
|
Community Views
|
Will be heard through
the plan change submission and hearing process.
|
|
Benefits
|
Nationally standardised
best practice, a realistic and manageable two-step pathway for rezoning,
protects land from inappropriate development, an integrated and flexible
planning approach, and enables cost sharing.
|
|
Risks
|
Untested approach to
greenfield planning for the city, not fully understood or accepted by
landowners / developers, resistance to cost sharing, an additional step to
‘live’ zoning, may not deliver all the urban form and function
outcomes of Options 1, 2 and 3.
|
|
Financial
|
Uses existing 2024-34
LTP budgets (Y1: $204k and Y2: $261) to progress step 1. Developers fund step
2 ‘live’ zoning via private or Council led plan changes. Reassess
progress and budgets as part of 2027 LTP.
|
|
OPTION 5:
|
Rely on Private Plan
Changes to rezone Kākātangiata to Residential
|
|
Community Views
|
Will be heard through
the plan change submission and hearing process.
|
|
Benefits
|
Conventional and well
understood, flexibility for landowners / developers to progress when they are
ready.
|
|
Risks
|
Complex / inefficient
process, poorly coordinated and fragmented land development, less Council
control, difficult to co-ordinate infrastructure funding and delivery when
needed.
|
|
Financial
|
Costs covered by
landowners / developers. Growth paying for growth.
|
Rationale for the recommendations
1. Overview of the problem or opportunity
1.1 The
rezoning of the Kākātangiata Urban Growth Area
(Kākātangiata) from Rural to a range of urban zones (Residential,
Local Business and Recreation) to enable development has been difficult to
progress since 2010. The rezoning process to date has relied on conventional
planning methods which have proven complex, costly and inefficient resulting in
significant delays. Apart from the Kikiwhenua Residential Area, the bulk of the
land identified in Map 9.2 of the District Plan has yet to be rezoned. These
issues have been exacerbated by:
- The 2010-11
Christchurch earthquakes and the need to more fully understand liquefaction
risk and cost-effective mitigation responses;
- The number of
landowners and stakeholders involved and their competing interests;
- The
increasing scale of the land area over time;
- The adoption
of PNITI by the NZTA Waka Kotahi board in 2021 and subsequent discussion
regarding the alignment of the Manawatu Regional Freight Ring Road (MRFRR); and
- The decision
of the 2024/34 LTP not to fund supporting infrastructure for
Kākātangiata.
1.2 The
issues experienced with rezoning Kākātangiata are not unusual for
greenfield development of this scale, and they are commonly experienced by many
councils across the country.
1.3 The
time, costs and complexity associated with rezoning land is one of the drivers
of the Government’s plan to replace the RMA 1991. Regardless of what
planning and resource management legislation is in place, the rezoning of land
at this scale will be a complex process.
2. Background and previous council decisions
Residential Growth Strategy
2.1 In
2010 Council adopted the Residential Growth Strategy which identified City West
(later named Kākātangiata) and Whakarongo as preferred areas for
future residential development.
2.2 In
response to the 2010-11 Christchurch earthquakes, the Residential Growth
Strategy was amended in 2012. The amendment prioritised the zoning of
Whakarongo and delayed the rezoning of Kākātangiata until further
information was known about how best to address liquefaction risk in
Kākātangiata.
2.3 The
2018 LTP process also identified the need to provide greater guidance and
additional residential land at Aokautere. District Plan Change G was developed
in response to this direction and is nearing completion. The outstanding appeal
on Plan Change G is scheduled for an Environment Court hearing in August 2025.
District Plan Work Programme
2011-2020
2.4 While
the implications of liquefaction risk to urban development were being
investigated across the country post the 2010-11 Christchurch earthquakes, Council
commenced its Sectional District Plan Review (SDPR). Preparation of the SDPR
commenced in 2011 and was completed in December 2018. SDPR Plan Change 15A
reviewed the Rural Zone in 2014-15 and inserted Map 9.2, City West –
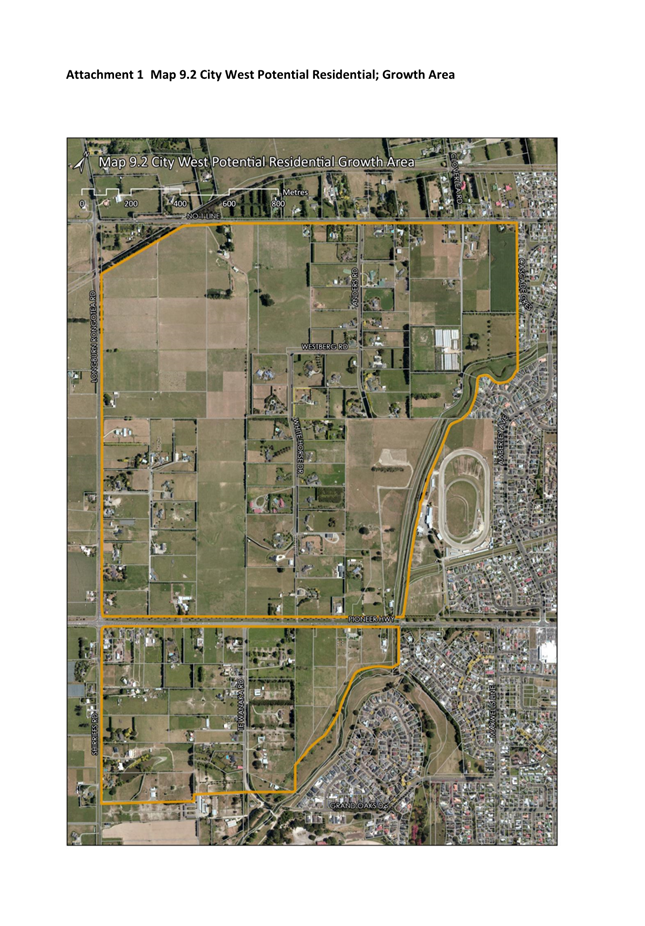
Potential Residential Growth Area (see Attachment 1).
2.5 Post
the Whakarongo Residential Area becoming operative in the District Plan in 2015
and the completion of the SDPR in 2018, work began understanding the resource
management challenges associated with Kākātangiata. The Kikiwhenua
Residential Area was rezoned in 2020 as stage 1 of Kākātangiata. This
plan change area was identified as the extent or urban growth that could be
delivered without significant investment in water and wastewater
infrastructure.
Scaling up of Land Area and
Yield
2.6 The
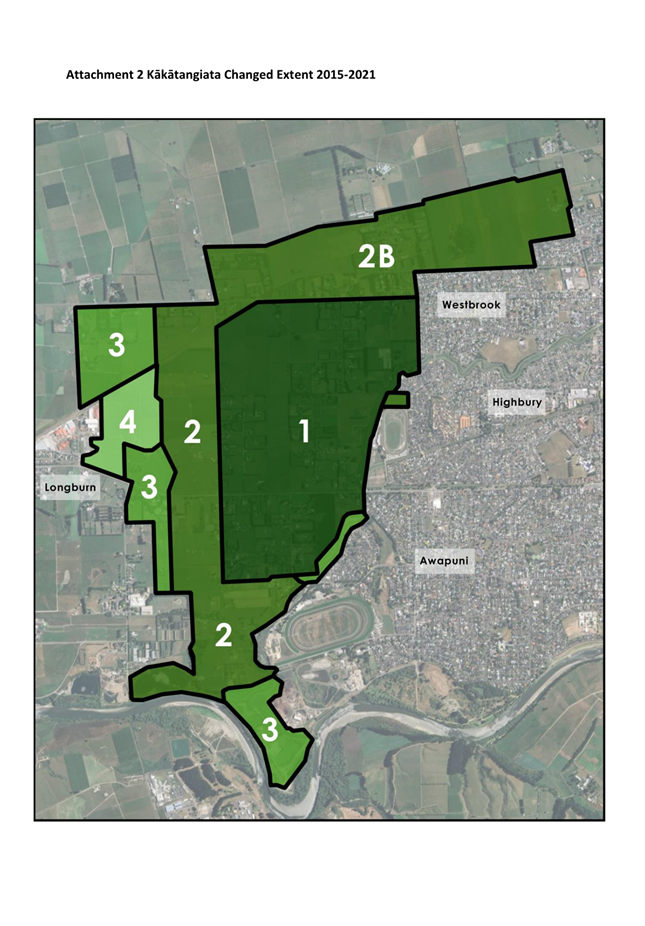
original extent of Kākātangiata (see Attachment 1 and Area 1
in Attachment 2) was initially bounded by:
- State Highway
56 (Pioneer Highway) (SH56), Longburn-Rongotea Road and No 1 Line (Tremaine
Avenue); and
- Land south of
SH56 between the Mangaone Stream and Te Wanaka Road and land between Te Wanaka
Road and Sheriffs Road.
2.7 The
2019 HBA identified a shortage of greenfield land to meet projected demand for
housing in the medium to long term and noted additional land needed to be
identified for long-term housing growth.[2]
In response, the extent of Kākātangiata has changed over time to
respond to a projected shortfall of greenfield land over the long-term as
follows (see Attachment 2):
1. November
2015: 306 ha
2. March
2020: 693
ha
3. March
2021: 797
ha
4. May
2021: 842
ha
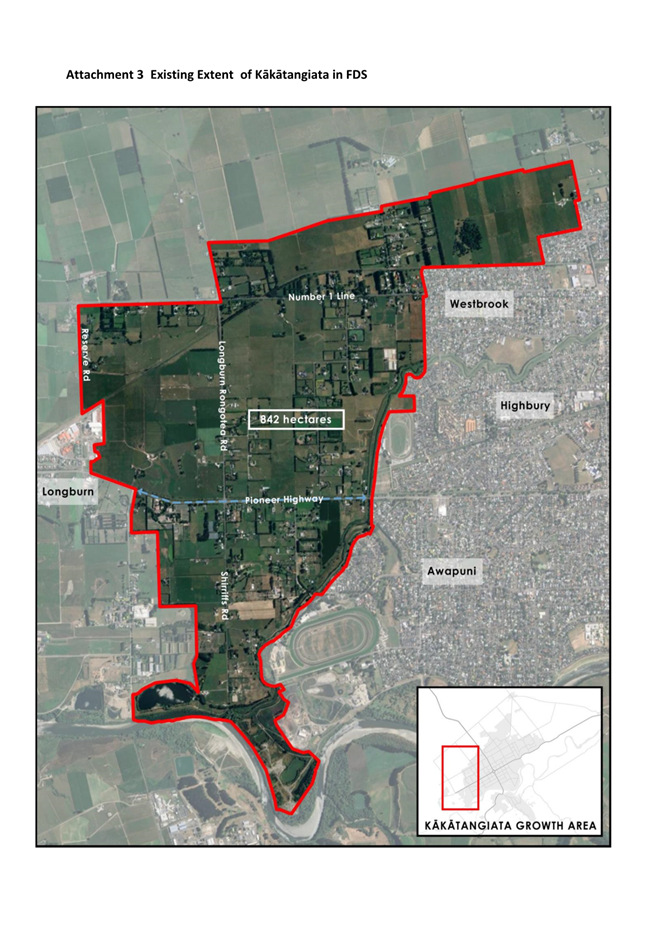
2.8 The
scale of Kākātangiata has increased significantly since 2015, growing
from 306ha to 842ha (see Attachment 3). However, the conventional
planning response has struggled to grapple with the increased complexity
associated with the increased scale of Kākātangiata.
Previous Work
2.9 Significant
work has been undertaken to support rezoning Kākātangiata for urban
development in recent years, including:
· High-level
support in the Housing and Business Needs Assessment (HBA) and Future
Development Strategy (2019-2024);
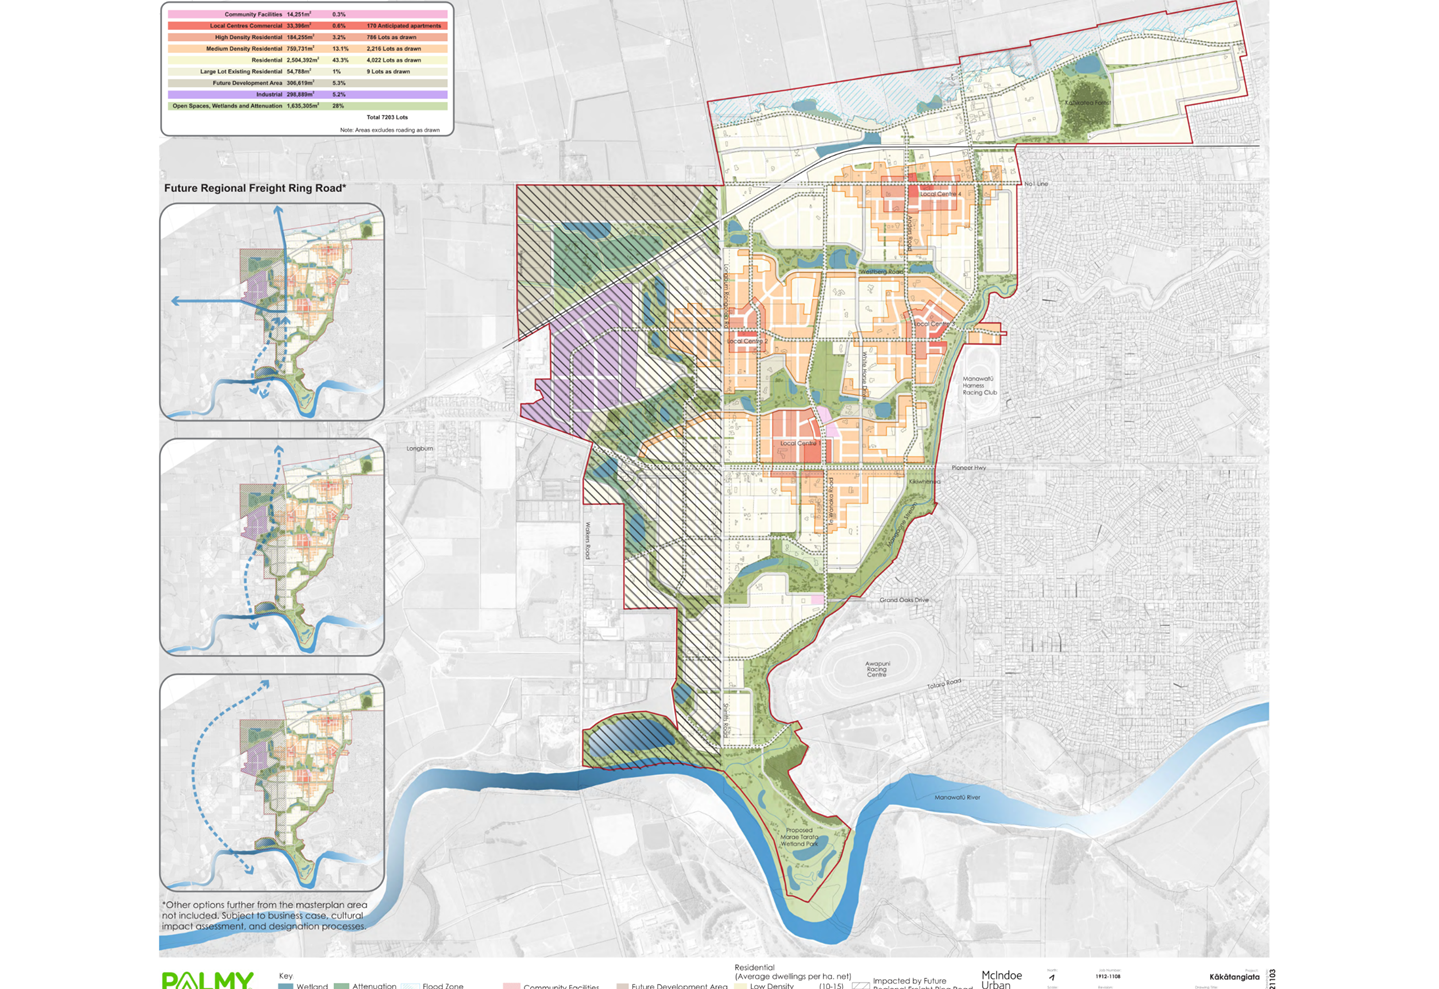
· A
detailed master planning exercise to determine the potential spatial extent,
scale, and form of urban development and other features (2022) (see Attachment
4);
· Comprehensive
technical studies and reports covering transport, ecology, flood risk,
liquefaction, contamination, economics and other key matters (2019-2025);
· Development
of a Cultural Values Assessment with Rangitāne (2020-2021);
· Council
led consultation processes (2020-2021); and
· Strong
developer and landowner interest in urban development.
As a result of this work the urban development potential of
Kākātangiata is well understood.
Resetting the Key Assumptions for
Kākātangiata
2.10 As
discussed in the City Planning Priorities and 3-Year Work Programme report
presented to the 14 August 2024 Strategy and Finance Committee, staff have been
in the process of resetting some of the key assumptions sitting behind
Kākātangiata. The reset looked at:
- The
funding and financing options available to support growth at
Kākātangiata in light of changes to LTP funding assumptions for
greenfield growth.
- Understanding
how available funding and financing options will shape the planning framework
needed to enable development.
- Reviewing
the extent of the proposed zone considering increased scale between 2015-2021
and the future alignment of the Manawatu Regional Freight Ring Road (MRFRR).
- Reviewing
the extent of the proposed area that Council may want to rezone, and what
portion could be left to the market to advance private plan change
applications.
- Reviewing
the extent of control exerted through the District Plan via master planning and
associated design controls.
- Assessing
what procurement model is best placed to deliver the plan change in a timely
manner given the size and scale of the zoning proposal.
Reset Planning Response: Future
Urban Zone
2.11 The
Future Urban Zone (FUZ) is a planning tool established by the National Planning
Standards that can be applied to rural land that has been identified as being
suitable for urban development. It has three purposes:
1. It formally acknowledges
the future urban development potential of greenfield areas in the District
Plan, both spatially and through legally binding planning provisions;
2. It protects greenfield
areas identified for urban development from inappropriate and ad hoc
development such as rural residential subdivision and other incompatible land
uses that may compromise the future development potential of the land; and
3. It establishes a clear
process and framework for rezoning based on prescribed structure plan
requirements and development area provisions, which also provide flexibility in
the timing, location and scale of urban development.
2.12 The FUZ
can be more generally described as a ‘holding zone’ where land can
continue to be used for a range of rural activities, and subdivision and urban
development is discouraged until a structure plan is prepared and the land
rezoned. Structure planning helps achieve an optimal type, form and extent of
urban development, and demonstrates how future development can be adequately
serviced by infrastructure.
2.13 This
approach introduces a three-step process for rezoning:
Step 1: The FUZ – introduces a
high-level structure plan and planning provisions that articulate the broad
resource management outcomes being sought for the whole of the growth area (the
extent being that shown in Map 9.2 of the District Plan).
Step 2: Private Plan Changes:
involves private plan change requests that use the FUZ to inform a more
detailed and fleshed out structure plan and planning provisions. Private plan
changes respond to and enable the site-specific needs of development while ensuring
the broad growth area outcomes articulated in the FUZ for the whole growth area
are achieved.
Step 3: Council initiated Plan Changes
for any residual land not rezoned via Private Plan Changes: The
final stage of rezoning that is likely to address smaller land holdings and /
or areas with multiple owners that are not addressed via Step 2.
2.14 The FUZ
proposal leverages off all previous work meaning existing Council and developer
investment in enabling the future development of Kākātangiata will not
be lost.
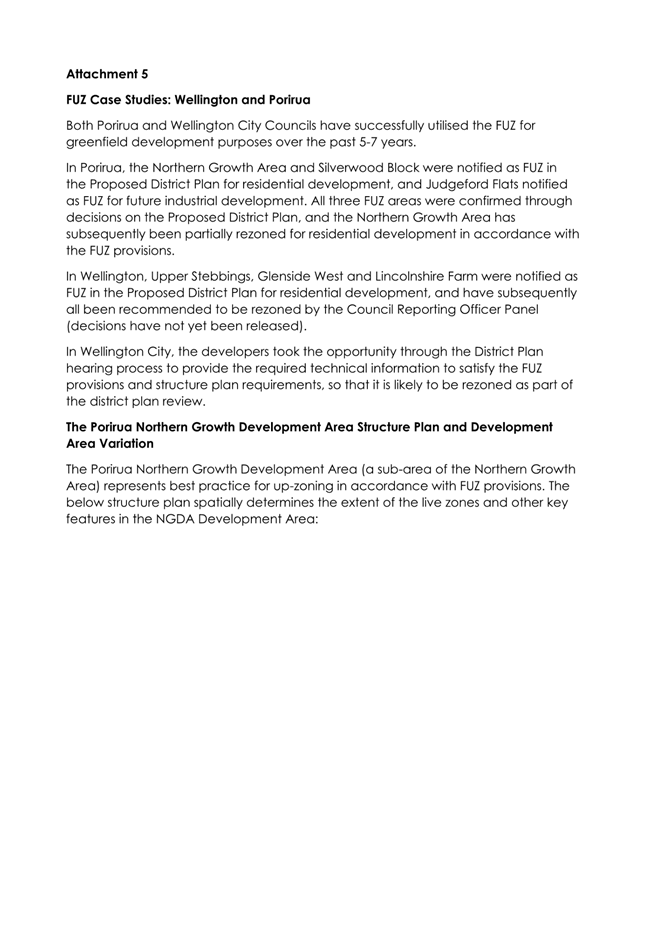
2.15 Case
studies of how the FUZ has been successfully used to enable urban development
in the Wellington Region are provided in Attachment 5.
2.16 Scaling
Down Kākātangiata: the proposed reset of Kākātangiata
includes reducing the extent of the land area proposed for rezoning to FUZ to
make the process more manageable and enable timely land supply. It is proposed
the extent of the FUZ will cover the area shown as Area 1 in Attachment 2.
Area 1 aligns with Map 9.2, City West – Potential Residential Growth Area
shown in Attachment 1.
2.17 Areas 2-4,
shown in Attachment 2, will sit outside the proposed FUZ and are
proposed to be treated as follows:
Area 2b (located north west of the Main Trunk
Railway Line (MTRL), including the Manderson Block):
o Will
remain identified in the FDS for residential development via private plan
change requests (700 lots).
Areas 2, 3 and 4 (located to the west of Longburn
Rongotea Road and Shirriffs Road, and south of Area 1):
o The
land’s suitability for future residential development will be
re-evaluated in the next review of the FDS in late 2025/26. If the indicative
business case for the MRFRR identifies Longburn Rongotea Road and or Shirriffs
Road as part of the preferred future alignment, residential development on both
sides of the road alignment may undermine the suitability and operational
efficiency of this planned strategic freight route.
2.18 Limited
Resource, Reliance on Private Plan Changes and Shifting Cost: the cost of
developing a coordinated planning framework to support development of a further
1000 lots at Aokautere cost approximately $2.2m over the period 2018-2024.
While $2.2M is a significant cost, it equates to $2,200 per lot to establish a
robust planning framework for the entire neighbourhood. To date, Council has
spent $214,000 in 2025/26 responding to an appeal on the Aokautere plan change.
These costs have been borne solely by Council.
2.19 The cost
of the Aokautere Plan Change G (PC G) was driven in-part by the level of
control and certainty over the planning outcomes sought by Council. The
planning approach for PC G reflected the long history of compliance issues in
this part of the city, poor urban form outcomes under the previous District
Plan and the desire of Council to ‘complete’ the establishment of a
neighbourhood at Aokautere.
2.20 While
Council have commissioned a suite of technical reports since 2019 to support
the rezoning of Kākātangiata, a significant amount of additional
spend is required to fully develop a plan change ready for public notification
under the RMA. The LTP has budgeted $204k and $261K in years 2 and 3 to develop
the Kākātangiata District Plan Change. When looking at the scale of
Kākātangiata and then considering the cost of developing the smaller
Aokautere plan change, the year 2 and 3 budget will not be sufficient to
progress a plan change to rezone the area to residential.
2.21 The FUZ
will not provide the same level of Council control over urban form and function
outcomes as PC G. However, the cost, complexity, and time associated with
delivering a plan change similar in nature to PC G, of the scale proposed in
Kākātangiata, will be costly and time consuming.
2.22 Private
plan changes will have to respond to and deliver on the key urban form and
function outcomes articulated in the FUZ but will not provide Council with as
much control over planning outcomes as current zoning approaches at Aokautere
and Roxburgh Crescent.
2.23 Given the
current restrained fiscal environment, the FUZ provides a level of control that
balances the maximization of planning outcomes while minimising cost. Given
current LTP settings, the City Planning Team does not have the level of
resource to manage Kākātangiata in the same manner as Aokautere.
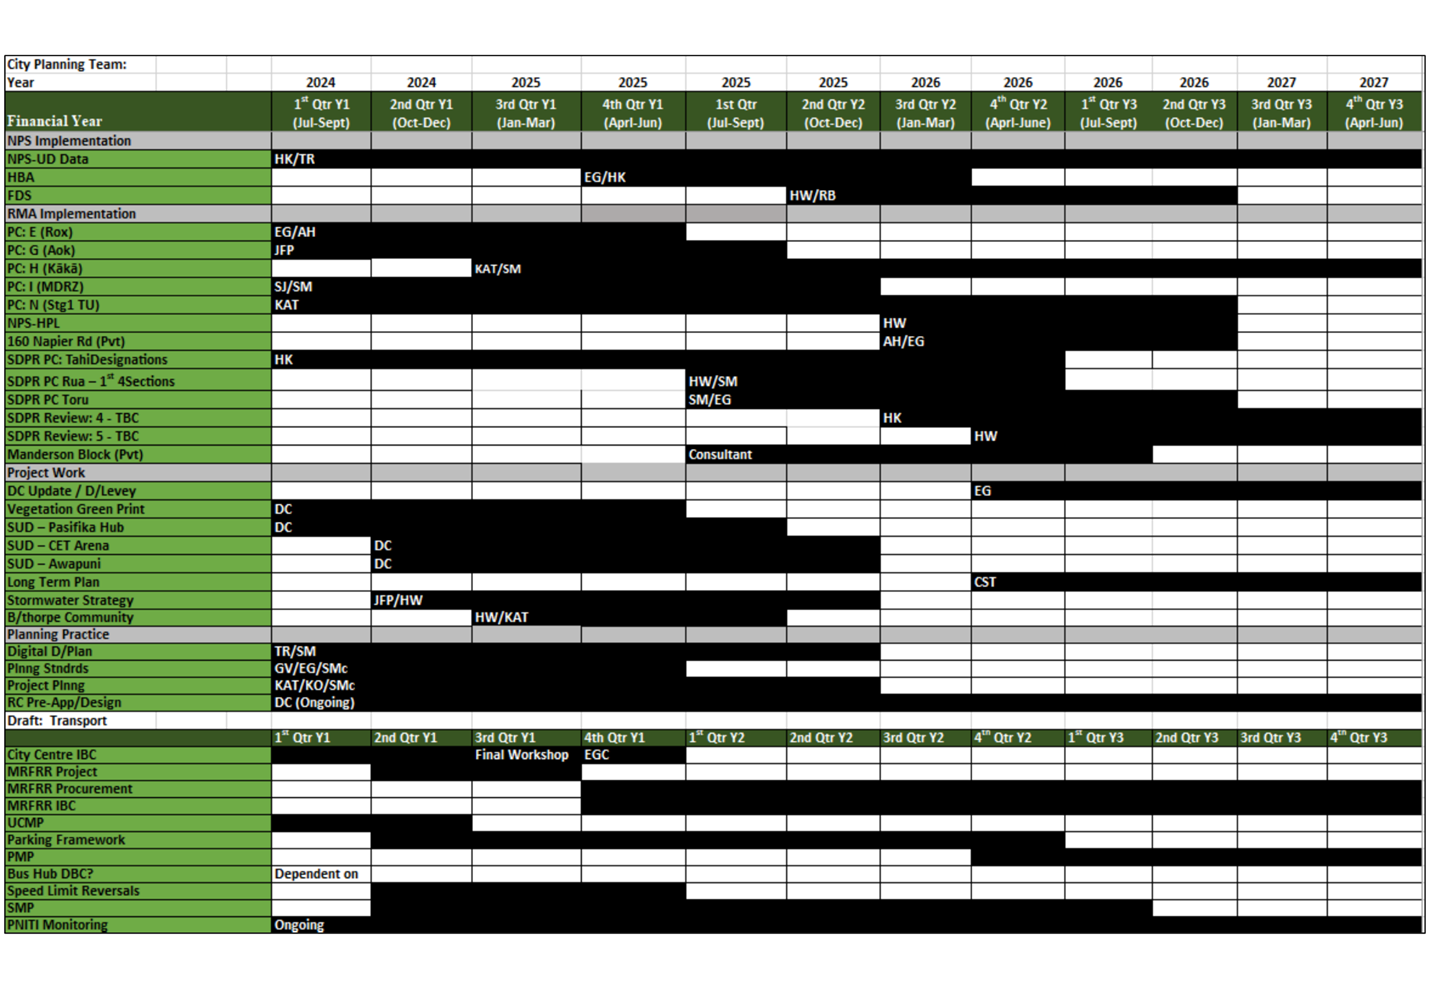
2.24 Balancing
3 Year Work Programme Priorities – the City Planning Team’s 3
-year work programme is extensive. Alongside zoning land to provide for growth
(Aokautere, Roxburgh Crescent, Plan Change I and Kākātangiata), the
team has reinitiated the Sectional District Plan Review (SDPR). It is now well
over 10 years since key parts of the District Plan were reviewed and parts of
the Plan are no longer fit for purpose (see Attachment 6, 3 Year Work
Programme).
2.25 The
proposed approach to the FUZ will free up resource to assist the City Planning
Team to meet Council’s statutory obligation to review the District Plan
while meeting obligations to plan for residential growth under the National
Policy Statement for Urban Development (NPS-UD).
2.26 Relationship
of FUZ Process with Pending Private Plan Change Requests – staff are
working with and advising several developers in the wider
Kākātangiata Urban Growth Area who are at various stages of
developing private plan change requests. A proposed private plan change in Area
2b, (see Attachment 2), for approximately 700 homes, is expected to be
lodged in the second half of this year. This private plan change request will
not affect the rezoning of the scaled down Kākātangiata area to FUZ.
2.27 A number
of developers are exploring the potential to lodge private plan change requests
within the proposed FUZ area. Staff are considering options to progress the FUZ
in parallel with these private plan change proposals in a way that aligns
outcomes. Discussions are under way with the relevant developers to assess
whether the FUZ and private plan changes can be developed concurrently and
possibly notified together as a coordinated package.
2.28 Relationship
of FUZ Process with the pending replacement of the Resource Management Act 1991
– The exact nature, timing and implications of the replacement of the RMA
1991 remains uncertain. Whatever happens, the new legislation is likely to
involve a long transition period. The existing provisions of the District Plan,
including the FUZ, will have a significant influence on any new regional or
sub-regional planning document produced under the new legislation. It is also
anticipated that the existing National Planning Standards will continue to have
a role under the new legislation, including the FUZ.
3. Description of options
3.1 The
recommendation to proceed with a FUZ for Kākātangiata has been based
on an assessment of 5 options. These are described below:
Option 1: Rezone Kākātangiata to Residential
using existing resources and budget allocated in 2024/34 LTP (current approach)
– continuing with the current approach to rezoning
Kākātangiata using existing resources and budget allocated in the
2024 – 34 LTP.
Option 2: Rezone Kākātangiata to Residential
with increased budget 2025/26 - 2026/27 – continuing with the current
approach to rezoning Kākātangiata, but with reprioritised budget in
year 2 and additional budget in year 3 of the 2024-34 LTP. Reassess
progress and budget as part of the 2027 LTP. This option will require larger
budgets in years 2 and 3 of the 2024 LTP than option 3.
Option 3: Rezone Kākātangiata to Residential
with increased budget 2025/26 - 2029/30 – continuing with the current
approach to rezoning Kākātangiata, but with reprioritized budget in
year 2 and additional budget in year 3 of the 2024-34 LTP. Reassess progress
and budget as part of the 2027 LTP. This option spreads the costs of a longer
time period than option 2.
Option 4: Rezone Kākātangiata to Future Urban
Zone using existing budget allocations for 2025/26 and 2026/27 –
establishes a clear process and framework for rezoning based on prescribed
structure plan requirements and development area provisions.
Option 5: Rely on Private Plan Changes to rezone Kākātangiata
to Residential – relies on landowners and developers coming forward
individually with private plan changes to facilitate development.
3.2 The
benefits and risks associated with these five options have been assessed and
summarised in Section.
4. options Analysis for rezoning of
kākātangiata
|
|
Kākātangiata
rezoning analysis
|
|
OPTION 1:
|
Rezone
Kākātangiata to Residential using existing resources and budget
allocated in 2024/34 LTP (current approach)
|
|
Community Views
|
- Previous
plan changes have been notified with limited community opposition.
- General
acceptance of the need for greenfield urban growth through the FDS.
|
|
Benefits
|
- Conventional
and well understood planning process.
- Significant
existing investment by Council in this approach.
- Expectation
of developers and landowners that is approach will continue.
- High
level of Council control over planning outcomes.
|
|
Risks
|
- Complex,
unwieldy and inefficient process (cost and time).
- Significant
programme delays experienced with no land yet rezoned.
- Landowner
and developer frustration at delays.
- Private
plan changes initiated ahead of Council zoning process.
- Not
helping to meet the City’s housing and business needs in the short to
medium term.
- Private
plan change requests progressing ahead of Council process.
- National
Policy Statement – Highly Productive Land
|
|
Financial
|
- High
costs borne by ratepayers to date.
- Budget
allocated in LTP not sufficient to cover the cost of a full plan change.
|
|
OPTION 2:
|
Rezone
Kākātangiata to Residential with increased budget 2025/26 - 2026/27
|
|
Community Views
|
- As
per option 1.
|
|
Benefits
|
- As
per Option 1.
- Additional
budget allocated could assist with delivery.
|
|
Risks
|
- Unlikely
to resolve the programme delays currently being experienced.
- Landowner
and developer frustration at delays likely to continue.
- Unlikely
to help meet the City’s housing and business needs in the short to
medium term.
- Private
plan change requests progressing ahead of Council process.
- National
Policy Statement – Highly Productive Land
|
|
Financial
|
- Higher
costs to be borne by ratepayers than the current approach.
- Current
budget allocated in the LTP insufficient to cover the cost of a full plan
change. Approximate cost $2m.
- Will
require reprioritization of year 2 budget and additional budget in year 3.
- Will
require larger budget in years 2 and 3 than option 3
- Progress
and budgets reassessed as part of 2027 LTP.
|
|
OPTION 3:
|
Option
3: Rezone Kākātangiata to Residential with increased budget 2025/26
- 2029/30
|
|
Community Views
|
- As
per Option 1.
|
|
Benefits
|
- As
per Options 1 and 2.
|
|
Risks
|
- As
per Option 2.
|
|
Financial
|
- As
per Option 2 but costs spread over longer time period.
- Will
require reprioritization of year 2 budget and additional budget in year 3
- Progress
and budget reassessed as part of 2027 LTP.
|
|
OPTION 4:
|
Rezone Kākātangiata
to Future Urban Zone using existing budget allocations for 2025/26 and
2026/27
|
|
Community Views
|
- General
acceptance of the need for greenfield urban growth through the FDS.
|
|
Benefits
|
- A
nationally standardised best practice approach to greenfield urban
development.
- Provides
a realistic and manageable two-step pathway for rezoning.
- Protects
land from inappropriate subdivision and land use which may compromise future
development potential.
- Structure
plan guidance and development area planning provisions provide integration
and flexibility in the spatial extent, timing and form of urban development.
- Provides
statutory weight to national, regional and city-wide strategic development
objectives.
- Ability
to enter in cost-sharing arrangements in accordance with the principle of
‘growth paying for growth’.
|
|
Risks
|
- An
untested approach to greenfield urban planning in Palmerston North.
- May
not be fully understood or accepted by landowners and developers.
- Resistance
to cost-share agreements by landowners and developers.
- Additional
steps required for rezoning.
- Private
plan change requests progressing ahead of Council process.
- Less
Council control over planning outcomes than Options 1, 2 and 3, but more
control than Option 5.
- National
Policy Statement – Highly Productive Land
|
|
Financial
|
- Lower
cost compared to residential plan change (Options 1, 2 and 3), and within
existing LTP budget.
- Cost
recovery or cost-share agreements for full rezoning can be entered into.
|
|
Option 5:
|
Rely on Private Plan
Changes to rezone Kākātangiata to Residential
|
|
Community Views
|
- Previous
plan changes have been notified with limited community opposition.
- General
acceptance of the need for greenfield urban growth through the FDS.
|
|
Benefits
|
- Conventional
and well understood planning process.
- Provides
flexibility to landowners and developers to progress with rezoning when they
are ready.
- Costs
covered by landowners and developers.
|
|
Risks
|
- Complex
and inefficient process (cost and time).
- Likely
to result in poorly co-ordinated and fragmented land development.
- Less
Council control and direction leading to greater risk of sub-optimal
development outcomes.
- Difficult
to predict and co-ordinate private plan changes with infrastructure funding
and delivery.
- National
Policy Statement – Highly Productive Land
- Lack
of leadership on core Council function
|
|
Financial
|
- Costs
predominately borne by landowners and developers.
- Agreements
for cost recovery or coast share agreements for Council can be entered into.
|
5. Rationale for recommending a future urban zone
5.1 The
FUZ is considered the best option for rezoning the Kākātangiata Urban
Growth Area because it provides a manageable, structured and nationally
standardised approach to urban development.
5.2 Unlike
previous methods, which have proven complex, inefficient and resulted in
significant delays, the FUZ enables a more streamlined and predictable planning
pathway. It protects the area from inappropriate rural subdivision and other
land uses that could compromise future development potential. By formally recognising
the area’s suitability for urban development and aligning with national
standards, the FUZ ensures long-term strategic co-ordination and minimises
fragmented growth.
5.3 From
a financial perspective, the FUZ offers significant advantages. It is more cost-effective
than the current approach and fits within Council’s current LTP budget,
unlike the conventional rezoning options that require additional resourcing
although with no certainty of delivery. It also allows for future cost-recovery
mechanisms, such as cost-sharing agreements with developers, aligning with the
principle of ‘growth paying for growth.’ This reduces the financial
burden on ratepayers while ensuring that infrastructure and planning costs are
equitably distributed and efficiently managed.
5.4 Given
the constrained fiscal environment, the FUZ offers Council a planning
instrument that ensures an acceptable level of control over urban growth
outcomes while balancing cost efficiency.
5.5 In
terms of community support and alignment with Council objectives, the FUZ is
consistent with engagement outcomes from the FDS, which demonstrated broad
acceptance of greenfield urban growth. It also upholds strategic goals by
enabling sustainable and integrated development, contributing to the city’s
economic growth and resilience.
5.6 While
the FUZ is a new approach for Palmerston North and may require time to be fully
understood by stakeholders and our partners, its benefits in terms of clarity,
coordination, and cost effectiveness make it the most prudent and future
focused option.
6. Conclusion
6.1 The
FUZ is considered the most effective and strategic option for progressing
development of the Kākātangiata Urban Growth Area. It provides a
manageable, nationally recognised framework that protects the land for future
urban development, reduces costs to Council, and supports coordinated,
sustainable urban growth. While new to Palmerston North, the FUZ builds on
previous planning work and aligns with community views and Council’s
long-term plans.
7. Next actions
7.1 Initiate
Plan Change Process – prepare and notify a district plan change to
apply the FUZ over the Kākātangiata Urban Growth Area. Indicative
notification in April 2026.
7.2 Stakeholder
Engagement – begin targeted engagement with key landowners,
developers, Rangitāne o Manawatu, and infrastructure providers to ensure a
shared understanding of the FUZ approach and structure planning requirements.
7.3 Structure
Planning Framework – develop a high-level structure planning
programme and accompanying guidance for the future development areas within
Kākātangiata.
7.4 Cost
Sharing Strategy – establish a cost-sharing and funding approach for
development area plan changes to ensure the ‘growth pays for
growth’ principle is upheld.
8. Outline of community engagement process
8.1 Since
2020, staff have undertaken significant engagement with landowners and
developers who have ownership interests within the wider Kākātangiata
Urban Growth Area, along with surrounding landowners, central and local
government agencies, and Rangitāne o Manawatu (RoM). Development of the
Kākātangiata Master Plan (see Attachment 4) was heavily
influenced by RoM. In particular, the Whānau Ora Principles woven into the
spatial layout of the Master Plan were driven by RoM.
8.2 Consultation
on the FDS in 2024 was city wide in its scope and comprehensive in nature. Over
400 submissions were received on the FDS, with significant support for the
greenfield development option, including the Kākātangiata Urban
growth Area.
8.3 In
respect of the FUZ, landowners, the community, and Council’s partners
will be engaged through the stakeholder engagement approach outline above and
interested parties will also have the opportunity to lodge a submission and be
heard at the hearing when the FUZ is notified.
9. Compliance and administration
|
Does the Council have delegated
authority to decide?
|
Yes
|
|
Are the decisions significant?
|
No
|
|
If they are significant do they
affect land or a body of water?
|
No
|
|
Can this decision only be made
through a 10 Year Plan?
|
No
|
|
Does this decision require
consultation through the Special Consultative procedure?
|
No
|
|
Is there funding in the current
Annual Plan for these objectives?
|
Yes
|
|
Are the recommendations
inconsistent with any of Council’s policies or plans?
|
Yes
|
|
The recommendations
contribute to:Whāinga 1: He tāone auaha, he tāone tiputipu
Goal 1: An innovative and growing city
|
|
The recommendations contribute to this
plan:
15.
Mahere whare
15. Housing Plan
The objectives are:
· Implement the
National Policy Statement in Urban Development Capacity
· Rezone Kākātangiata
|
|
Contribution to strategic
direction and to social, economic, environmental and cultural well-being
|
Zoning Kākātangiata
to Future Urban Zone will assist Council in meeting its obligations to ensure
there is sufficient development capacity to meet projected demand, which will
assist with improving housing affordability and being responsive to growth.
|
|
|
|
Attachments
|
1.
|
Map
9.2 City West Potential Residential Growth Area ⇩ 
|
|
|
2.
|
Kākātangiata
Changed Extent 2015-21 ⇩ 
|
|
|
3.
|
Existing
Extent of Kākātangiata in FDS ⇩ 
|
|
|
4.
|
Kākātangiata
Masterplan Feb 2022 ⇩
|
|
|
5.
|
FUZ
Case Studies Wellington and Porirua ⇩ 
|
|
|
6.
|
City
Planning Team 3 Year Work Programme ⇩
|
|
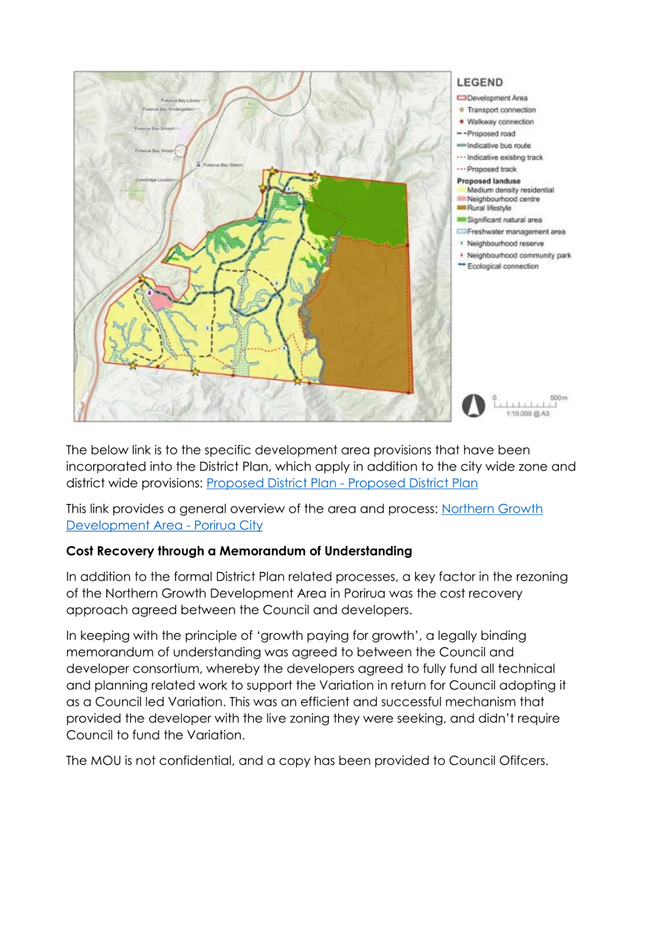
Memorandum
TO: Council
MEETING DATE: 25
June 2025
TITLE: 21
Havelock Avenue, Bill Brown Park: Proposal to grant a lease on Council land to
Kia Toa Football Club Incorporated - Deliberations Report
Presented
By: Glenn
Bunny, Manager Property and Perene Green, Property Officer
APPROVED BY: Chris
Dyhrberg, General Manager Infrastructure
RECOMMENDATION(S)
TO Council
1. That Council
grant a community lease to Kia Toa Football Club Incorporated at 21 Havelock
Avenue, part of Bill Brown Park, Palmerston North, in accordance with the
Support and Funding Policy 2022 and Section 54 of the Reserves Act 1977.
2. That Council
note that the land affected by the proposed community lease to Kia Toa Football
Club Incorporated is Lot 1 DP40097 and Lot 442 DP44423.
1. ISSUE
1.1 Kia
Toa have requested a land lease at Bill Brown Park with the view to construct
clubrooms on their ‘home ground’ to provide recreational activities
for the community.
1.2 Council
consulted the community on the proposal to lease part of 21 Havelock Avenue for
the purpose of clubrooms.
1.3 This
report seeks approval to grant a new lease to Kia Toa in accordance with
Section 54 of the Reserves Act 1977 and Council’s Support and Funding
Policy.
2. BACKGROUND
2.1 A
report
titled ‘Bill Brown Park – Proposal to support Kia Toa Rugby
Football Club Incorporated by notifying the intention to grant community
occupancy via a lease of Council land’ was presented to the Strategy and
Finance Committee on 26 February 2025. Please refer to this report for
additional background. The report recommended that public consultation be
undertaken of Council’s intention to enter a new lease arrangement with
the club.
2.2 Public
notice was published in the Manawatu Standard on 7 April 2025 in accordance
with Section 119 of the Reserves Act 1977. Consultation was undertaken
between 7 April to 9 May 2025.
2.3 The
Strategy and Finance Committee on 28 May 2025 received copies of all
submissions and held a hearing
for submitters who wished to be heard in person as required by Section 120 (1)
(c) of the Reserves Act 1977. While hearings were scheduled, no submitters
attended.
2.4 At
the same meeting the Committee received a report
titled ‘Summary of Submissions – Bill Brown Park proposed land
lease to Kia Toa Rugby Football Club Incorporated’. 306 submitters
supported the proposal and 9 were against the proposal. Please refer to
this report for details on the submissions received.
2.5 If
entered into, the proposed lease will commence on 1 July 2025 and will be for a
term of thirty-three (33) years, as per the Committee resolution on the 26
February 2025.
2.6 The
proposed annual rental is $150 plus GST. This is consistent with the
rental framework in Council’s Support and Funding Policy 2022.
2.7 The
proposed lease area is 751m² as outlined in
Red in Figure 1 below.

Figure 1: Proposed lease area at Bill Brown Park
3. Consideration
of submissions
3.1 The
Reserves Act Section 120(1)(d) requires Council to consider any objections
raised in public submissions regarding the proposal before making a decision.
3.2 Three
tables are provided for consideration of submissions:
· Table 1 sets out
the reasons for objections received and responses (including issues of
concern about alcohol raised in submissions in support).
· Table 2 sets out
the issues raised in submissions that supported the proposal but had
some concerns.
· Table 3 answers
those questions raised in submissions – either on opposition or in
support.
Table 1: Responses to
objections
|
Matters raised in opposition
|
Number
|
Officer Comment
|
|
Alcohol related issues and questions (from both
opposition and in favour):
· Behaviour
· Impact on Pasifika Centre
· Social/community harm
· Proximity of licenced premises to early childhood
centres, churches, and community centres
· Be alcohol free, given the number of young people
playing for the club
· How will no alcohol be policed?
· Make hire events not alcohol-free, but have the bar
run by the club
· Alcohol in plenty would need to be monitored
|
5 in opposition
plus concerns from submissions in support
|
This report is only requesting approval to grant a
lease, Kia Toa will be required to comply with the provisions of all
statutes, ordinance, regulations and by-laws. In order to serve
alcohol, Kia Toa will be required to apply to the District Licencing
Committee for the appropriate Alcohol Licence. It should be noted
that the District Licencing Committee is independent of Council and that
timeframes are prescribed by legislation, as such officers can offer no
assurance regarding the outcome.
|
|
Impact on the Pasifika hub
|
4
|
The proposed lease area is outside of the current proposed
Pasifika Hub scope of works. There is a risk of occasional conflicts
e.g. if both had events or activities on at the same time putting pressure on
parking. However, it is a large park and has been the traditional home
ground of Kia Toa which is a 123 year old club.
|
Table 2: Responses to
Concerns/Comments from those supporting the proposal
|
Concern or comment from submissions in favour (alcohol cover in opposition section)
|
Number of submitters
|
Officer Comment
|
|
Amount of on-site parking
|
4
|
Prior to the Kia Toa proposal, Council had budgeted
for the extension of the carpark by approximately 32 carparks. The
carpark extension is budgeted for 2027/2028 of the Long Term Plan. Kia
Toa have indicated they would like to see the carpark construction bought
forward into the 2026/27 year to better fit with their development timing.
|
|
Fear of increased vandalism/boy
racers/gangs/unwanted visitors
|
2
|
Officers acknowledge the comment. Kia Toa have
advised that if any issues are caused by their members or patrons,
disciplinary action can be taken. Kia Toa will be responsible for the
maintenance of their building from vandalism.
|
|
Prefer
closing to be no later than 10/10.30pm
|
2
|
The District Plan allows for recreation zone hours
from 7 am to 11.30 pm Sunday to Thursday and 7 am to 1.30 am Friday and
Saturdays.
Hours of the alcohol licencing would be considered
in the licencing process.
|
|
Proposal
that Kia Toa buys the land instead of leasing it
|
1
|
Kia Toa representative has provided comment and do
not have any desire for purchasing of land.
Council would prefer to retain land ownership to
avoid a third party owning land in the middle of a reserve/park, retaining
flexibility for use were Kia Toa to ever vacant.
|
|
Suggestion to give local businesses connected to this club the
opportunity to tender first and help them work through the bidding process
before going to market
|
1
|
Kia Toa has been notified of this comment and are
giving consideration to the feedback provided.
|
|
Lack of lighting on the playing fields
|
1
|
Council do not own lights on the Bill Brown Park
fields. Lighting currently on the training fields are owned, maintained
and operated by Kia Toa.
|
Table 3: Questions raised in
submissions
|
Questions raised
|
Officer Comment
|
|
How much rent would be paid to Council?
|
The rental will be $150 plus GST, as per the rental
framework under the Support and Funding Policy 2022.
|
|
If another club proposed this, would they be given
the same opportunity?
|
All for-purpose groups are provided the same
opportunities, provided what is proposed can fit in the reserve without too
much impact and they meet the requirements of the Support and Funding Policy
and Reserves Act 1977.
|
|
Apart
from rugby, what other events will take place?
|
Kia Toa was formed as a rugby club and currently
also includes Netball. Kia Toa has had other sport codes teams in the
past and is open to inclusion of other sports.
|
|
What
happens to the ownership of the building at the end of the lease?
|
The lease includes clauses regarding this
matter. If Council does not wish to purchase the building or come to an
arrangement with Kia Toa, they will be required to remove the building.
If Kia Toa are unable to remove it, then Council would decide whether to
remove it at Councils expense (or sell it for removal if feasible) or take
over ownership and lease it to another club or group.
|
|
Who
would take over maintenance of the building if the club is unable to maintain
it?
|
If Kia Toa is unable to maintain the building, as
the landlord, we would arrange maintenance and on bill any associated
costs. If Kia Toa could not afford the maintenance costs, Council would
need to decide if it would enact clauses about breach of the lease and
consider termination clauses. There would need to be major maintenance
issues to be using this process.
|
|
How
will Council ensure the lease is upheld and public space is not limited in
any way?
|
Council monitors complaints about leases. It
also has Service Level Agreements with the sports codes that use the fields
at Bill Brown that can provide feedback as well as regular engagement with
the Pasifika Community Centre management. If issues arose, they would
be addressed with Kia Toa.
If major issues occurred, and could not be remedied,
and Kia Toa were in breach of their lease conditions, the steps set out in
the lease would be enacted. This is considered unlikely.
|
|
What
conversations have been had with Mana Whenua Rangitāne about this
decision?
|
Rangitāne have been consulted on the proposal
both by Council Officers and Kia Toa has approached Rangitāne senior
representatives directly. They have supported the proposal for Kia Toa
lease.
|
4. Discussion
and Conclusion
4.1 Council
has supported Kia Toa through Service Level Agreements under Manawatu Rugby
Union for the use of the Bill Brown Park Sports fields and changing rooms on a
seasonal basis. Kia Toa intends to provide further opportunities for the
public to support Council’s strategic direction.
4.2 Bill
Brown is the home ground of Kia Toa and has ample space to accommodate the
clubrooms without negatively impacted the wider reserve use. The
Clubrooms are expected to add value to the sporting community and any negative
impacts to be manageable.
4.3 Having
considered the objections, it is recommended that Council proceed with granting
a new lease.
5. NEXT
STEPS
5.1 Enter
a new lease agreement between Palmerston North City Council and Kia Toa for
part of 21 Havelock Avenue.
5.2 Kia
Toa will manage the building consent application process.
6. Compliance
and administration
|
Does the Council have delegated
authority to decide?
|
Yes
|
|
Are the decisions significant?
|
No
|
|
If they are significant do they
affect land or a body of water?
|
No
|
|
Can this decision only be made
through a 10 Year Plan?
|
No
|
|
Does this decision require
consultation through the Special Consultative procedure?
|
No
|
|
Is there funding in the current
Annual Plan for these objectives?
|
Yes
|
|
Are the recommendations
inconsistent with any of Council’s policies or plans?
|
No
|
|
The recommendations contribute
to:
Whāinga 1: He tāone
auaha, he tāone tiputipu
Goal 1: An innovative and
growing city
Whāinga 2: He tāone
whakaihiihi, tapatapahi ana
Goal 2: A creative and exciting
city
Whāinga 3: He hapori
tūhonohono, he hapori haumaru
Goal 3: A connected and safe
community
|
|
The recommendations contribute to this
plan:
6.
Mahere rēhia
6. Recreation and Play
Plan
The objective is: places across
the city and its neighbourhoods for communities to take part in play and
recreation.
|
|
Contribution to strategic
direction and to social, economic, environmental and cultural well-being
|
The recommendation is in line
with Council’s Support and Funding Policy which supports for-purpose
groups to occupy, and operate out of, Council-owned property for sporting,
and recreational purposes.
|
|
|
|
Attachments
Nil
Memorandum
TO: Council
MEETING DATE: 25
June 2025
TITLE: Public
Participation and Engagement: Annual Progress Report, and proposed
indicators.
Presented
By: Olivia
Wix - Manager Communications
APPROVED BY: Danelle
Whakatihi, General Manager Customer & Community
RECOMMENDATION(S)
TO Council
1. That Council
endorse the proposed indicators for future annual public participation and
engagement reports.
1. BACKGROUND
Elected Members requested: That
the Chief Executive (a) develop key civics indicators to report against, and
(b) provide a progress report annually to assess the effectiveness of the
civics education initiatives.
The first
annual progress report is provided in Attachment 1. It covers public
participation and engagement activity from 1 January 2024 to 31 March 2025.
This timeframe was chosen to reflect what happens in an average year, but we
extended it slightly to make sure the Long Term Plan work was included. We ended the period in March to ensure we could bring this
report to Council for endorsement of indicators prior to the proposed period
for future reporting.
Officers
recommend that in future, these annual reports will cover the 12-month period
from 1 July to 30 June and will be presented to Council each year in September.
This aligns with the annual reporting timeframes.
As we have not
had endorsement for the indicators that will be used to measure progress, this
first report focuses on showing the range and volume of work completed during
the timeframe.
Since this
work has not been formally tracked by staff collectively at an organisational
wide level before, it is possible that some engagement activity may have been
missed from this report.
The annual
progress report will be available on the Council website under the ‘What
goes where’ section. It will also be used as a reference point when
people ask how Council has gathered feedback or involved the community in its
work.
From next year
onwards, annual reports will include, if endorsed, the indicators proposed
later in this memo.
While much of
our engagement is motivated by a genuine desire to inform, educate, and listen
to our community to support good decision-making, some engagement is also
required by law or is a condition of external funding—for example, the
waste levy. Both types are reflected in the
report.
The work
outlined in the annual progress report, along with the draft indicators, is all
within our existing levels of service and is not part of a standalone
programme. If elected members would like to see more work, or additional
indicators included in future, this may have implications for staffing and
budgets.
This Council
memo sets out what is included in our engagement work, why people want to take
part and the challenges they face, what we’ve learned from other
research, what we are already planning on doing more of, and how that
information has shaped the proposed indicators.
Defining public
participation and engagement
Before developing indicators, it
is important to define the scope of this work. While the Council resolution
refers to “civics education,” officers recommend using the term
“Public participation and engagement” instead. This better reflects
a partnership approach—working with our community rather than implying
the community needs to be ‘educated.’
Officers proposed definition
is:
“Public participation and
engagement refer to any activity that helps people understand how Council and
local government work, how decisions are made, and how they can participate or
have a say. It is about building people’s knowledge, confidence, and
motivation to engage with Council processes — from understanding roles
and responsibilities, to knowing how to give feedback, report issues, or
contribute to shaping their community. It also includes helping people learn
more about specific Council services, projects, and issues that affect their
daily lives, so they can make informed contributions and feel more connected to
local decision-making.”
It is important to clarify that
everyday contact—like calling to report an issue, emailing about a
building consent, waving to a recycling truck driver, chatting to a parking
warden, talking to the water team on the street, commenting on a facebook post
and so on, is not included in the scope of the annual progress report or the
proposed indicators. These one-on-one interactions are important and valued,
but this report focuses on broader, intentional opportunities for engagement
that are more visible and accessible to the wider community. These include but
are not limited to: public consultations and submissions, large-scale
campaigns, drop-in sessions, open days, facility and site
tours, attendance at expos and events, co-hosted hui and community
workshops, school and university visits, and stakeholder forums.
This distinction helps ensure we
are consistently tracking and reporting on meaningful, inclusive opportunities
for the public to engage with Council decisions, services, and planning.
Based on
conversations with colleagues in other councils and sector networks, we are
aware that we already deliver a high volume of public engagement and
communication compared to other councils of a similar size. While this is
anecdotal, the consistency of this feedback across multiple sources gives us
confidence in that assessment.
We
offer a wide range of opportunities for people to learn about and engage with Council,
from community meetings, public consultations, and school visits to guided
facility tours, pop-up events, and open days – with a strong emphasis on
face-to-face interaction, which helps build trust and understanding. Council
staff are proactive and willing to try new approaches, using creative formats
and tools to reach different audiences and make our processes more accessible.
The work already underway reflects a deep commitment to helping people
understand what Council and Elected Members do and how they influence the
decisions that shape their city.
What
we know about engagement with local government
Helping people understand and participate in local
government is essential, but not without challenges. There are real barriers,
for both the organisation and our communities.
· Our
community is busy and stretched
Most residents are juggling work, family, and other
responsibilities. Even those who are interested might not have the time or
energy to engage. Council information can get lost among the many messages
people receive each day and staying informed and involved can feel like another
task on a long list.
· Engagement
is usually issue-by-issue
People tend to get involved when something affects
them directly — like a road change or a local park upgrade. We rarely ask
about the Council's work in its entirety, and residents do not often think
about how local government fits into the bigger picture. This is an area we
have been focusing on more over the past 18 months to give more general
opportunities to engage.
· Topics
can be complex and time-consuming
Some council matters, such as water reform, require
reading detailed information to fully understand the issue. That is a big ask
of busy people. By comparison, something like whether a dog should be on leash
at Linklater Reserve is easier to understand and engage with. We do our best to
explain things clearly, but even simplified material can still be a lot for
people to work through. Coming to a meeting or open day can also feel intimidating
for those unfamiliar with council processes.
· Schools,
groups, and organisations plan ahead — and have limited room for
more
While schools and community groups are often keen to
connect with Council, their calendars are planned well in advance, and time is
limited. Rest homes, clubs, and other organisations often welcome visits, but
their capacity to host speakers or organise trips to council facilities is
constrained. Making space for learning more and getting involved can be a
challenge, even when the interest is there.
· Limited
time, budget, and dedicated roles
We do not have a specific staff role dedicated to
“civics education.” Instead, this work is carried out by many staff
alongside their primary responsibilities. Planning and delivering high-quality
civics initiatives — like classroom sessions or public workshops —
takes time and coordination, and some schools require us to develop full lesson
plans and attend multiple meetings with teachers before we even begin. There is
also no dedicated budget for this work. However, with sufficient funding, we
could achieve a significant lift in public understanding and involvement
— even without a major increase in staff resources. For example, this
could include establishing citizen panels, designing a localised curriculum
pack for schools, or producing regular hard copy newsletters that explain key
Council issues in plain language for the wider community.
· We
often ask for feedback — but not everyone feels heard
There's a common perception that Council does not
listen. In reality, we do listen - but it is not always possible to act on
every piece of feedback. Often, people do not see their view reflected in the
final decision and may assume their input did not count. In truth, many
decisions involve balancing a range of perspectives, evidence, and legal or
funding constraints.
· Positive
interactions do not always lead to formal participation
We regularly talk with people at events, in libraries,
through advisory groups, and out in the community. These informal conversations
are valuable, and often enough for people to feel heard or have their questions
answered. But they do not always translate into things like formal submissions
or voting. That does not mean those people aren't engaged, just that engagement
can look different from what we can measure.
· We
are limited in the personal data we can ask for
We are limited in the demographic data we can collect
during engagement. We cannot ask for personal information like age, ethnicity,
or gender unless we have a clear and specific reason. This means that for most
consultations, we do not collect this kind of data. As a result, we often do
not have a full breakdown of who we are reaching. It makes it harder to tell
whether we are hearing from a broad cross-section of our community or if some
groups are missing from the conversation. Asking for data can also be off
putting. It is more questions for people to fill in, and they may feel that it
isn’t relevant for us to know that information. That could put them off
having their say altogether.
· Engagement
does not always feel safe or accessible for everyone
Some residents, and sometimes staff and Elected
Members, can feel uncomfortable speaking up when a discussion is dominated by
strong, forceful, and on occasion aggressive or threatening people. This can
affect who chooses to participate and how. We want to ensure that everyone has
opportunities to engage in a way that feels safe and inclusive for them, while
also caring for the wellbeing of our staff and elected officials.
· Change
takes time, and that can cause frustration
There's often a long gap between asking for public
input and being able to make decisions or take visible action. That delay can
make people feel like nothing has happened, or that their views were ignored,
even when their feedback did play a role. We know that closing the loop is
important and are working to get better at showing how public input helps shape
decisions. This can be for major things like consultations, or even just
someone logging a job for a pothole. Expectations of when something should
happen as a result of their feedback is varied.
· Language
and cultural diversity
Language differences and cultural backgrounds may
affect whether people feel comfortable accessing council information or feel
confident participating. Tailoring our communication and engagement to meet
diverse needs is important and something we are trying to do more of, but it is
still hard to make a significant shift in participation.
· Youth
engagement challenges
Younger people often feel disconnected from
traditional council processes because they’re less likely to own property
or see how council decisions relate to the issues they care about.
· Confusion
about roles and responsibilities
Many residents find it difficult to understand which
level of government—central government, council, or regional
council—is responsible for different services or decisions. This can create
frustration and make it harder for people to know where to direct their
questions or feedback. We often see this in the transport space with NZTA
roads and Horizons’ buses, but also some see council as being responsible
for things like the hospital or schools.
· Lack of central government action in civics education
Central government needs to do more to improve public understanding
of how government works as a whole. When people have a clearer picture of the
roles and responsibilities across all levels of government, it becomes easier
for them to understand how local government fits into the bigger picture. A
good example of this working well is the Electoral Commission, which
effectively manages elections and helps people understand voting processes.
However, this level of support is rare, and more is needed to boost civics
education overall.
We
have a good understanding of what helps people engage
· If
it is simple and quick to understand
The
more straightforward it is — with short, plain language, not too much
reading, and only a couple of easy questions — the more likely people are
to take part.
· It
affects their day-to-day life, especially in a way they see as
negative
People
are more likely to engage if they think something will impact them,
particularly if they are worried it might make things worse. We see more
engagement when changes involve roads, rubbish, parks, or services people use
regularly, or when it comes to rates increasing. People are often less
likely to get involved for “positive” things.
· There
are different ways to give feedback
We
already offer a mix of options, including online forms, email, face-to-face
chats, and creative submissions like drawings or videos. This helps people
choose what works best for them.
· We
use events to talk to people
Using
events that are already happening in the community is a good way to reach
people informally. It means we can have natural conversations without asking
people to make a special trip or commitment. We meet them where they are. It
is a particularly good way to engage with people who may be less likely to make
a submission or come to a formal council meeting or drop-in.
· We
offer flexible times and locations
We
already try to include a range of times and settings for our drop-ins and
events, including evenings and weekends, so people with different routines can
get involved.
· We
make personal contact
Staff
regularly reach out to individuals and groups, including preparing tailored
messages or flyers for stakeholder organisations to share with their networks.
We also work through community and reference groups we have established
relationships with, asking them to help spread the word or encourage
participation within their circles. This targeted approach often leads to
stronger turnout and more relevant feedback.
· People
get to take part, not just observe
In
many of our face-to-face engagements, we create opportunities for people to
give input directly, whether that is through interactive displays, one-on-one
conversations, or simple activities that spark discussion.
· They
feel like their feedback matters
We
respond directly to people who give feedback, often with a follow-up email or
summary of what we heard. We are also publishing engagement summaries on our
website, so it is clear how community input is being used. Being transparent
builds trust and keeps people involved. We do need to do a better job at
keeping people updated on more day to day service level requests.
· We
open the doors to places people do not usually see
Tours
of facilities like the recycling centre, water treatment plants, and other
operational sites help people understand the scale and complexity of the work
Council does. These behind-the-scenes opportunities give residents a tangible
connection to services they might otherwise take for granted, and help build
trust through transparency.
We
also have insights from other organisations’ reports.
The
Local Government Voters report by Local Government New Zealand, published in
November 2023, found that people are more likely to vote in local elections if
they have lived at the same address for more than ten years. Turnout among the
18–25 age group remains lower than other age groups, although it is gradually
increasing. The highest levels of participation were seen in people aged 61 and
over, and those living in rural areas were more likely to vote than those in
urban centres. People who chose not to vote said they were either not
interested, too busy, or not interested in local government specifically.
In
its 2024 issues paper, the Electoral Reform Working Group of LGNZ identified a
low understanding of what councils do as a major barrier to both engagement and
turnout. It noted that more community-wide education is needed, not just
through schools. The paper found that women, older residents—especially
those aged 66 and over—and people who have lived at the same address for
ten years or more are the most likely to vote. In contrast, Māori,
Pasifika and Asian communities, renters, and people under the age of 45 are
less likely to vote, although participation in the under-45 age group is slowly
increasing. The paper said that turnout could be improved if people had better
access to clear information about what councils do and how council decisions
affect their daily lives. It also highlighted the need for simpler ways to
engage with councils, better information about candidates, and more guidance on
how people can provide feedback and influence decisions. Greater awareness of
citizens’ rights and responsibilities was also seen as important. In
addition, the paper encouraged councils to use a wider range of engagement
methods, such as participatory budgeting, citizens’ panels or assemblies,
and collaborative planning.
How this informs our indicators
These insights about local government
and community engagement have guided us in selecting the indicators outlined
below. They ensure we measure the most relevant aspects of participation, communication,
and trust to better understand and improve how we engage with our community.
There
are some opportunities we are looking at now
· Keep
using co-design where possible on projects.
This occurred for Featherston St, Highbury
revitalisation and is underway for the Bunnythorpe Community Plan
· Provide
more detailed information about the processes for how people can make requests
but also speak at Council, as well as more detail about how decisions are made.
This work will happen over the coming months so it is
ready to refer to once the new Council is in place.
· We
are planning on piloting an email newsletter.
Councils who have these, have noticed a spike in users
since some community publications have been discontinued. We are looking at
piloting a monthly email newsletter in the coming months.
· Once
the new Council is in place, we are looking at how we can share content about
the work our elected members do (opt-in).
This could include updates on decisions, days in the
life, and summaries of all the engagement elected members do.
· Once
the new Council is in place, we will seek feedback on whether elected members
would be open to having a regular general drop in session for our
community to come chat about all the things we do.
Similar to how the Mayor does this in Ashhurst, but
across the city on a regular day/time that we can promote, with some key staff
able to assist elected members. This is a suggested action following some
community requests, but also some comments of members of the public wanting
more face to face opportunities to speak to elected members informally.
· In
consultations, we will add a question to ask why people care about the topic.
This data will help guide us on what motivates people
to make submissions. This could help with our communications and engagement efforts.
· Consider
the outcomes of the focus group programme.
Based on the feedback we get; we will
trial and roll out some different ways of talking about things we
do.
We believe these initiatives have
real potential to shift the dial on community engagement and awareness. By
improving transparency, expanding communication channels, and creating more
meaningful opportunities for involvement, we expect to see positive changes
reflected in our indicators. These efforts will help us build a more informed
and engaged community over time.
There are additional engagement
methods we could explore in the future, such as citizens’ panels, juries,
and participatory budgeting. However, these approaches require significant
staff time and/or funding, which we currently do not have available.
Potential indicators for future reporting.
Building on a clear definition, insights into effective approaches
and challenges, relevant research, and current and planned initiatives, the
following proposed indicators have been developed by officers. These indicators
combine data from the Residents Survey, existing records, and information that
can be easily tracked going forward. Their implementation requires no
additional budget or staff resources.
|
Indicator
|
What the data is
|
What it may tell us
|
Where the data comes from
|
|
Opportunities to participate in
decision-making
|
Total number of engagement
opportunities through formal consultations or feedback periods. This data can
track whether elected members were in attendance.
|
The range and frequency of formal
opportunities people have to shape decisions
|
Officers to track
|
|
Number of other formal
participation
|
E.g. number of petitions, public
comments.
|
Whether people are aware of/feel comfortable
using the most formal channels available to them
|
Meeting records, governance team.
|
|
Opportunities to learn about
Council
|
Number of general engagement events
not tied to consultation (e.g. Esplanade Day, drop-ins, community visits)
|
Whether we are offering chances to
learn about Council in everyday settings rather than only specific topics
|
Officers to track
|
|
Awareness channels for
participation for consultation/feedback
|
This is a question we ask on formal
consultation and submission forms.
|
Which communication methods are
most effective
|
Website/hardcopy forms.
|
|
Engagement via Council website
|
Number of unique users
engaging with Council webpages related to “What Council does and the
‘Have your say page. Also include total user information and top pages,
and number of people using online forms for services.
|
Online interest in Council work and
ease of accessing info
|
Website analytics.
|
|
Social media engagement
|
Number of users reached
and engaged via Council social media platforms, benchmarked against
government averages.
|
Whether our digital engagement is
effective
|
Council officers
|
|
Civic engagement email newsletter
|
Number of subscribers to opt-in
civic newsletter
|
How many people actively want to
stay informed
|
Email platform
|
|
Motivations for participating
|
Themes in why people chose to
provide feedback
|
What drives people to engage
|
Website and hard copy form data
|
|
Engagement complexity rating
|
Staff rating of complexity
(simple/moderate/complex). Examples: Complex
would be Local Water/LTP. Simple would be dog on leash at
Linklater/playgrounds. Moderate would likely be policies or bylaws.
|
Helps contextualize the level of
effort required to engage
|
Officer tracking
|
|
Health & Safety
|
Number of public-related H&S
incidents logged
|
Any risks to public or staff or
elected members during engagement
|
PeopleSafe reports
|
|
Issue reporting by public
|
Number of reports via SnapSendSolve,
website, call centre etc.
|
How actively people are
participating in day-to-day interactions.
|
Website, Call Centre and
SnapSendSolve data
|
|
Library engagement
|
Number of active members and
physical visits
|
Passive civic learning and
engagement via libraries
|
Library team data
|
|
Perceived availability of Council
info
|
% of residents who feel
well-informed
|
Whether residents feel they have
access to the info they need
|
Residents Survey
|
|
Perceived ease of participation
|
% who feel it is easy to have a say
|
Perceived barriers to civic
engagement
|
Residents Survey
|
|
Perceived opportunity to be heard
|
% who believe they’re given
sufficient chances to contribute
|
Whether people feel Council listens
and values input
|
Residents Survey
|
|
Trust in Council decision-making
|
% who trust Council to make good
decisions
|
General sentiment about Council
performance and integrity
|
Residents Survey
|
|
Overall quality of life
|
% rating quality of life positively
|
Overall civic wellbeing and
connection to place
|
Residents Survey
|
|
Voter turnout – local
elections
|
% of enrolled voters who voted
|
Overall participation in democratic
process
|
Electoral Commission / Council
elections data
|
|
Voter turnout – general
elections
|
% of enrolled voters who voted
|
Broader civic participation trends
|
Electoral Commission
|
These
indicators are intended to give us a sense of patterns and shifts over time,
rather than to act as standalone performance measures. Careful interpretation
and context will be essential in understanding what the data is telling us.
It
is important to note that some indicators are likely to fluctuate year to year,
and changes in the numbers are not always good or bad in themselves. For
example, a higher number of issues reported through tools like Snap Send Solve
or the Council website could reflect increased community awareness and
confidence in using these systems, rather than a rise in frustration.
Similarly, the number of engagement opportunities provided will vary depending on
the type and scale of projects or consultations underway in any given year.
The Resident’s Survey
remains a useful tool for tracking high-level trends over time. Palmerston
North City Council delivers a wide and complex range of services, particularly
compared to most councils who do the survey who are far smaller or rural. Those
councils often report higher satisfaction scores, which may reflect lower
service complexity, fewer high-contact services, and closer-knit communities.
In contrast, urban councils tend to face more diverse expectations and
scrutiny, which can influence results.
The
Resident’s Survey is just one method for assessing our performance, not
the single factor. We can use other methods to complement it such as
communications-specific surveys or “voice of the customer”
approaches. These methods provide insight into service experiences, allowing
for faster responsiveness and potentially stronger reputational outcomes. Our
upcoming community focus groups connected to our residents’ survey will
also help us better understand how people perceive Council services,
information, and participation opportunities — giving important context
to interpret survey results and refine our indicators over time.
At
this stage, we do not have a set indicator that specifically measures the
significant civic engagement work undertaken by our elected members. While this
was considered, it was ultimately set aside due to the time and reporting
burden it would place on elected members to accurately track all of their
activities. Instead, we will look to reflect this important work more fully in
the next annual progress report, with narrative examples and highlights that
better capture the role elected members play in fostering civic participation
and connection.
NEXT STEPS
Officers will continue working in
this space, in partnership with the large amount of work Elected Members
do.
The next progress report will include
the new indicators and be brought to Council in September 2026, covering the
time period 1 July 2025-30 June 2026.
2. Compliance
and administration
|
Does the Council have delegated
authority to decide?
|
Yes
|
|
Are the decisions significant?
|
No
|
|
If they are significant do they
affect land or a body of water?
|
No
|
|
Can this decision only be made through
a 10 Year Plan?
|
No
|
|
Does this decision require
consultation through the Special Consultative procedure?
|
No
|
|
Is there funding in the current
Annual Plan for these objectives?
|
No
|
|
Are the recommendations
inconsistent with any of Council’s policies or plans?
|
No
|
|
The recommendations
contribute to: Whāinga 1: He tāone auaha, he tāone
tiputipu
Goal 1: An innovative and growing city
Whāinga 2: He
tāone whakaihiihi, tapatapahi ana
Goal 2: A creative and exciting city
Whāinga 3: He hapori
tūhonohono, he hapori haumaru
Goal 3: A connected and safe community
Whāinga 4: He
tāone toitū, he tāone manawaroa
Goal 4: A sustainable and resilient city
|
|
The recommendations contribute to this
plan:
14.
Mahere mana urungi, kirirarautanga hihiri
14. Governance and Active
Citizenship Plan
The objective is: Provide clear
and accessible information and opportunities for community input into Council
decisions
|
|
Contribution
to strategic direction and to social, economic, environmental and cultural
well-being
|
This inaugural report and
proposed indicators can give confidence to elected members that we are
meeting our objective. By having the report be publicly available on our
website it is also a transparent way for us to ensure our community knows all
the ways they can get involved.
|
|
|
|
Attachments
|
1.
|
Public
Participation and Engagement _ Annual Progress Report 2024-2025 ⇩ 
|
|
Memorandum
TO: Council
MEETING DATE: 25
June 2025
TITLE: Palmerston
North Quarterly Economic Update - June 2025
Presented
By: Stacey
Andrews, City Economist
APPROVED BY: David
Murphy, General Manager Strategic Planning
RECOMMENDATION(S)
TO Council
1. That Council
receive the Palmerston North Quarterly Economic Update – June 2025,
including:
a. Palmerston North
Economic Growth Indicators – June 2025 (Attachment 1), and
b. Palmerston North
Quarterly Economic Card Spending Report (Attachment 2).
1. purpose
1.1 This
memorandum presents a summary of the key themes in the Palmerston North
Quarterly Economic Update to June 2025, and the Palmerston North Quarterly
electronic card spending report for the March quarter 2024.
1.2 The
quarterly economic update is prepared in-house, using data from a range of
sources to provide the most up-to-date information available on the city
economy. This includes national and global data where appropriate, to
inform decision makers of broader conditions that are impacting on local
economic conditions.
1.3 The
quarterly economic update is organised under the categories of ‘Gross
Domestic Product (GDP) and national indicators’, ‘business and
jobs’, ‘earnings and income’, ‘spending’, and
‘housing’. National data that influences the city economy,
such as the Consumer Price Index (CPI) and the Official Cash Rate (OCR), are
also included in the quarterly economic update. This update is attached
as Attachment 1.
1.4 The
Palmerston North Quarterly electronic card spending report is prepared in-house
and provided as a resource to the city retail sector. This report includes
information on retail spending across the city and by precinct. The
electronic card spending report for the city is included as Attachment 2.
1.5 Section
2 of this report includes a high-level summary of economic outcomes for the
city to June 2025. A more in-depth analysis of economic performance,
including the economic outlook for the city, is included within sections 3 to 5
of this report.
2. Economic summary
2.1 Economic
activity in the city is showing some early signs of recovery as elevated
returns to the agricultural sector continue, construction investment and
recruitment intentions show signs of improvement, and lower interest rates flow
through to households and businesses.
2.2 Despite
strengthening in some economic indicators, GDP growth in the year to March 2025
continues to reflect the economic slowdown. March quarter GDP is
estimated to have fallen by 0.3% in both the city and nationally, compared with
the December quarter 2024. Annual GDP growth remains negative with GDP in
Palmerston North contracting by 1.3% in the March 2025 year, compared with a
1.1% contraction nationally.
2.3 Business
numbers increased +0.4% to 8,186 in Palmerston North over the year to March
2025, with an additional 34 businesses established in the city over the
year. This was lower than national growth of +1.2%.
2.4 Non-residential
construction values increased by 32.6% in the city over the year, driven by a
boost in investment in warehousing, commercial accommodation and education
buildings. This compares with a 7.6% fall in the value of non-residential
consents, nationally.
2.5 Jobs
data for Palmerston North city continued to reflect the weakness in labour
market conditions, with the number of people employed by place of residence
falling -876, (-2.5%) and jobs by workplace location down
-1,030 (-2.2%) over the year to March 2025. This
compares with 1.7% fall in jobs nationally over the same timeframe. More positively,
‘Seek’ employment data for April reflects strengthening employment
intentions with a 10% increase in jobs ads in the Manawatū-Whanganui
Region, compared with March. This compares with a 1.0% increase
nationally.
2.6 The annual average unemployment rate in Palmerston North
remains relatively stable at 4.3%. This compares with an annual average
unemployment rate of 4.9% nationally. Increasing Jobseeker beneficiary
numbers reflect the current labour market weakness with recipients in Palmerston
North rising 14.9% compared to an 11.6% increase in Jobseeker benefits,
nationally.
2.7 Annual
earnings growth has eased as expected in response to weaker labour market
conditions. Total earnings from salaries and wages increased 1.8% in the
city over the year, compared with 2.3% growth nationally. These earnings
figures exclude income from self-employment.
2.8 Tourism
and consumer spending remains soft, with the exception of new commercial
vehicle registrations which increased by 9.9% in Palmerston North over the
March 2025 year. This compares with 6.4% decline in commercial vehicle
registrations nationally, over the same timeframe.
2.9 House
sales in the city increased 14.2% over the year to April 2025 to a total of
1,321. This compares with a 9.5% increase in house sales
nationally. At the same time, house price growth remains subdued with the
average price in the city easing 1.6% over the year. This compares with a
1.3% decrease in house prices nationally. Housing continues to be far
more affordable in Palmerston North than at the national level, with the
average property in the city equal to 4.6 times the average city income.
This compares with the average house price of 6.5 times the average household
income nationally.
2.10 Weekly
rental prices increased by 3.0% in the city over the year to April 2025, to an
average price of $495 per week. The number of properties rented in the
city increased by 0.7% over the year to a total of 8,175. This compares
with a 2.8% increase in the number of rented properties, nationally.
2.11 New
dwelling consents increased 6.7% over the year to April 2025, to a total of
432. This compares with a 5.2% decline in new dwelling consents
nationally. Some of the increase appears to be explained by a rise in the
construction of relocatable dwellings in the city. Net dwelling data for
the March quarter estimates that 287 out of a total 426 dwellings consented in
the city over the year, will add to the housing stock. This rate has
eased to 67.4% in the year to March 2025, down from the longer term trend of
+70%.
3. Quarterly economic Update
GDP and National Indicators
3.1 Infometrics
reports that Palmerston North GDP fell by 1.3% over the year to March
2025. This compares with a 1.1% decrease in GDP nationally. The
Infometrics data is released prior to the Statistics NZ GDP data for the March
2025 quarter (released 19 June 2025).
3.2 Annual
inflation (as measured by the Consumer Price Index - CPI) increased from 2.2%
in the September and December quarters 2024, to 2.5% in the March quarter
2025. This was slightly above market expectations of 2.4%. The
higher than expected CPI reading was driven by stronger than expected costs of
transport, health, education, and recreation and cultural services in the March
quarter. This result remains well within the RBNZ target range of 1%-3%
CPI.
3.3 Negative
GDP growth highlights continued pressure on the New Zealand economy, with weak
spending, in particular, continuing to hamper the economic recovery. In
the latest Official Cash Rate (OCR) review, the Reserve Bank of New Zealand
(RBNZ) signalled concern over global uncertainty and near-term inflationary
pressures in the New Zealand economy. This is predominantly due to tariff
uncertainty and rising domestic electricity and food prices in the near term.
3.4 At
the time of writing, the market is pricing in a 25% chance of a 0.25% reduction
in the Official Cash Rate (OCR) at the next OCR review on 9 July. This compares
with the market pricing a 100% chance of a 0.25% reduction in the OCR in the
May review, reflecting the more negative tone of the RBNZ in the May Monetary
Policy Statement. Despite the more hawkish tone, the RBNZ actually
projected a lower OCR path in the May Monetary Policy Statement than in the
previous two reviews, as illustrated in figure 1. Lower interest rates
are critical to stimulating spending and economic activity and boosting
confidence across the New Zealand economy.
Figure 1: RBNZ OCR projections – May 2025, February 2025,
November 2025

3.5 On
the upside, the OCR has fallen 2.25% since its peak of 5.5% from May 2023 to
July 2024. The OCR currently sits at 3.25% with one-year and two-year
mortgage rates falling below 5% for the first time since March 2022. This
lower OCR will provide relief to households and businesses by lowering interest
payments on borrowing and releasing money for spending on other goods and
services across the economy. Alongside elevated demand and pricing for
exports produced in our region, lower interest rates will support the recovery
of the New Zealand and regional economy throughout 2025. Looking forward,
the level of inflation, alongside the appetite of the RBNZ to drop interest
rates into stimulatory territory, will influence the rate of recovery across
the local and national economy.
Business
and jobs
3.6 A
total of 8,186 businesses were located in Palmerston North in March 2025; an
increase of 34 businesses from the previous year (+0.4%). This compares
with a 1.2% increase in the number of businesses registered nationally, over
the same timeframe.
3.7 There
was a total of $139,952,697 worth of non-residential consents issued in
Palmerston North over the year to April 2025. This is an annual increase
of 32.6%, compared with a 7.6% contraction in the value of non-residential
consents nationally. Growth in non-residential construction in the city
was driven by a mix of public and private sector investment. In terms of
public investment, education sector construction increased by 190.9% to $10.25
million over the year. Growth in private sector construction investment
was dominated by a 164.8% increase in investment in ‘storage
buildings’ to a total of $89.53 million over the year. Investment
in ‘hotels, motels and short-term accommodation’ was also elevated,
rising 859.1% to a total value of $5.28 million.
3.8 Job
numbers fell in the city and nationally over the year. The number of
people in employment by place of residence fell by -876 (-2.5%) over the March
year while employment by workplace location decreased by 1,030 (-2.2%).
There was a total of 34,636 residents of Palmerston North in employment in
March 2025, alongside 46,575 jobs located in the city. This data does not
include self-employment.
3.9 Looking
forward, the latest Seek Employment report reflects an improving recruitment
trend across the Manawatū-Whanganui Region, with a 10% increase in jobs
advertised in April compared with March 2025. This compares with a 1.0%
increase in job ads nationally. Reflecting the more positive trend in the
Region, the number of jobs advertised over the year to April 2025 remains equal
to the year ended April 2024. This compares with a 10% decrease in the
number of jobs advertised nationally.
3.10 Implying
signs of an improvement in construction activity, the number of job ads for
‘design and architecture’ and ‘trades and services’
workers across the country increased by 15% and 6% respectively between March
and April 2025. In contrast, the number of roles advertised for
‘science and technology’ roles declined by 8% between March and
April 2025.
3.11 The annual
average unemployment rate in Palmerston North eased from 4.4% in March 2024 to
4.3% in March 2025. This compares with a 4.9% annual average unemployment
rate, nationally. The national unemployment rate published by Statistics
NZ was 5.1% in the March quarter 2025. This statistic does not average
the unemployment rate over four-quarters. The RBNZ expects the New Zealand
unemployment rate to peak at 5.2% in the June and September quarters this year,
falling to below 5.0% in the June quarter 2026.
3.12 The number
of MSD jobseeker beneficiaries in Palmerston North increased by 450 over the
year to March, to a total of 3,477. This is a 14.9% increase on the
previous year compared with an 11.6% increase nationally. Of this
increase, 270 people were receiving the benefit due to health conditions and
disability. Jobseeker benefits increased across all age-groups both in
the city and nationally.
3.13 Employment
data suggests improving labour market conditions over the year, due to the
export led economic recovery and households rolling off higher interest rates
onto lower mortgage interest rates. This will support spending, and
it follows employment levels across the New Zealand economy over the remainder
of 2025 and into 2026. This expectation is reflected in the RBNZ
employment projections, which anticipates the number of people employed
nationally will increase by 56,000 between March 2025 and March 2026.
Earnings
and income
3.14 Statistics
NZ publishes business collection data that estimates quarterly earnings at the
territorial authority level. This series is not as robust as the
Linked-Employer-Employee data but does provide a more-timely indication of
earnings from salary and wages by territorial authority area. From this series,
total annual earnings in the city in the March quarter 2025 increased by 1.8%
compared to the year ended March 2024. This compares with a 2.3% increase
in earnings nationally, over the same timeframe. This lower level of
earnings growth follows a period of +4.0% annual increases in the city between
June 2021 and December 2024.
3.15 Elevated
earnings growth continues to be reflected in the Statistics NZ median salary
and wages data for the year to March 2024, with median earnings in the city
increasing by 8.1% over the year. This compares with a 5.4% increase
nationally. Strong wage growth, due to sector wage agreements and tighter
labour market conditions, explains the elevated growth in earnings over the
year to March 2024.
3.16 Wage
pressure is easing in 2025 with the Labour Cost Index (LCI) falling to 2.8%
over the year to March. This follows a period of elevated wage growth
over the period March 2022 to December 2024 with annual wage growth peaking at
5.5% in the year to June 2023. As illustrated in figure 1, annual growth
in labour costs continues to remain above the 15-year average trend. The
RBNZ expects annual labour cost increases to return to the pre-COVID trend of
around 2.0% per annum in December 2025.
Figure 1: Labour Cost Index annual and 15-year trend (New
Zealand)
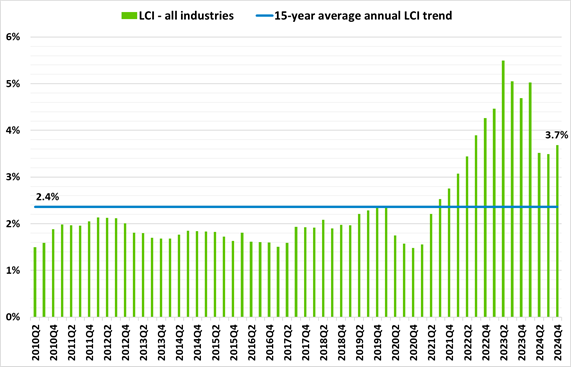
Spending
3.17 Retail
spending in the city decreased by -1.8% over the year to April 2025, to a total
value of $1.488 billion. This compares with a -1.5% fall in retail
spending nationally. Retail spending is in dollar value and does not
account for the impact of inflation on the purchasing power of
consumers. Negative growth in retail spending, alongside CPI
inflation of 2.5% over the year, indicates the continuation of a contraction in
consumption across the country over the year to April 2025.
3.18 The
pressure on household budgets continues to be reflected in the decrease in
spending in the city over the year to April 2025. Spending on
‘groceries and liquor’ was the only storetype to increase, up 1.3%
over the year. This growth rate remains below the annual rate of
inflation of 2.5% thereby indicating negative real growth in spending over the
year. ‘Groceries and liquor’ was the largest spending
category with a total spend of $529.6 million in the city over the year.
3.19 Spending
on discretionary items continued to be weak. Spending on ‘home and
recreational retail’ fell -3.1% over the year alongside a 3.5% fall in
‘fuel and automotive’ spending and a 3.0% fall in spending at
‘cafes, restaurants and bars’ in the city. This is consistent
with the national trend with spending falling across all categories other than
‘groceries and liquor.’
3.20 Following
the trend, new car registrations in the city fell by 12.2% over the year to
March 2025. This compares with a 17.8% fall nationally. In
contrast, commercial vehicle registrations increased by 9.9% in Palmerston
North relative to a 6.4% decline in commercial vehicle registrations,
nationally.
3.21 A total of
$296.2m in tourism spending flowed into the city over the year to April
2025. This is down 3.3% from the previous year compared with a 1.0% fall
in tourism spending nationally. Tourism spending continued to be impacted by a
pullback in spending by domestic travellers, falling 4.0% in the city and 3.5%
across New Zealand compared with the previous year. In contrast,
international tourism spending increased 4.7% to $27.1m in the city over the
year. This compares with a 7.0% increase in international tourism
spending nationally.
Housing
3.22 According
to QV, house prices in the city fell 1.6% over the year to April 2025 to an
average price of $634,094. This compares with a 1.3% fall in house prices
nationally, to $914,504. The volume of house sales continued to
strengthen in Palmerston North over the year, with 1,321 houses sold in the
April 2025 year. This is a 14.2% increase in sales volumes from the
previous year compared with a 9.5% increase in sales volumes
nationally. While house sales are increasing likely due to improved
affordability, elevated supply of houses for sale are keeping house prices
relatively stable.
3.23 Mortgage
lending increased to $82.0 billion in the year to April 2025. This
compares with $65.4 billion the previous year, representing a +25.4% increase
in mortgage lending compared with the year ended April 2024. Mortgage
lending to owner-occupiers and investors increased the most, up $9.6 billion
(+25.5%) and $5.5 billion (+48.3%) respectively. Lending to first home
buyers lifted by $1.3 billion (+8.6%) over the same period. The
proportion of total mortgage lending to investors has increased to 20.0% after
falling back to an historically low 16.5% in the year to June 2023.
3.24 Home
ownership affordability, as measured by Infometrics as the ratio of the average
house price to average annual income, remained at 4.6 for a second quarter in
March 2025. This compares with the average house price of 6.5 times
the average income, nationally. We note that the housing affordability
series has been recalculated recently to reflect higher earnings growth
relative to lower average house prices. This has resulted in a lower
ratio of average house price to household income through the series.
3.25 Average
rents increased 3.0% in the city over the year to April 2025 to an average
price of $495 per week. This compares with a +2.1% increase nationally to
$574. Over the same period, the number of properties rented increased by
+0.7% in Palmerston North, compared with a +2.8% increase nationally. As
at April 2025, 8,175 homes were formally rented in the city.
3.26 Renting a
home in Palmerston North remains more affordable than in much of New Zealand,
with annual average rent making up 20.1% of annual household income. This
compares with 22.1% nationally. Renting in the city continues to be more
affordable than both the Manawatū District and the wider
Manawatū-Whanganui region, with average annual rent taking up 20.8% and
22.0% of the average household income, respectively.
3.27 The number
of households on the public housing register in Palmerston North fell by 162
(-27.4%) to a total of 429 over the year to March 2025. This compares
with a 24.4% fall nationally. The number of families on the transfer
register in Palmerston North sat at 156 in the March quarter 2025, down from
165 a year ago (-5.5%). This compares with an 11.1% fall
nationally. Note, the criteria for being placed on the housing register
has been tightened under the current government, likely explaining a proportion
of the reduction in households on the public housing
register.
3.28 Households
in emergency housing in Palmerston North fell to nine in March 2025, down from
72 in March 2024. Some of the decrease in the number of families
accessing housing support may be explained by the increased level of evidence
required to prove housing need. The value of emergency housing grants
also dropped sharply, down from $1,125,668 in the March quarter 2024 to $97,649
in the March quarter 2025.
3.29 There were
432 consents for new dwellings issued in Palmerston North over the year to
April 2025, an increase of 27 (+6.7%) versus the previous year. This compares
with a -5.2% decline in new dwelling consents issued nationally. While
lower mortgage interest rates are likely to support levels of private
residential development moving forward, the pullback in development by
Kāinga Ora will weigh on levels of development in the city.
3.30 Net
dwelling analysis for the March year estimates that 287 of the total 426
dwellings consented over the year will add to the housing stock of Palmerston
North. This equates to 67.4% of total building consents issued annually in
contrast to the average +70% average. This series attempts to remove
‘relocates’ moved outside the city, add in ‘relocates’
coming into the city, and remove uplifted dwellings, and is subject to
revision. This provisional estimate is below the housing demand forecast
in the 2024-34 LTP of 328 dwellings per year from 2024-2027, with annual totals
tending to fluctuate due to wider economic conditions.
4. Palmerston North electronic card spending
report – March 2025
4.1 Reflecting
the current economic climate, total electronic card spending fell 2.0% in the
March quarter 2025 to a total value of $356 million. This compares with a
1.7% decrease in spending nationally, with spending gaining support from an
uplift in international tourism spending over the peak season.
4.2 Over
the year to March 2025, $1.492 billion was spent in the city. This is a
decline in spending of 1.5% compared to a 1.3% fall nationally over the same
period. Of this total, 56.6% was spent in the city centre.
4.3 Spending
in the city centre decreased by 0.8% over the year. The retail sectors
most affected by the pullback in consumer spending were ‘arts, recreation
& visitor transport’ falling 10.4%, ‘apparel and
personal’ down 3.7%, and ‘home and recreational retail’
decreasing by 3.3%. This is consistent with electronic card spending data
for many parts of the country, where domestic tourism and spending on
non-essential goods and services has come under pressure from weaker labour
market conditions and higher living costs.
4.4 In
contrast, spending on ‘groceries and liquor’, ‘fuel and
automotive’ and ‘other consumer spending’ all increased in
the city centre over the year. Spending on ‘groceries and
liquor’ rose 3.5% to a total of $285 million alongside a 1.3% increase in
spending on ‘fuel and automotive’ to $64 million, and a 7.8%
increase in consumer spending to a total of $1 million.
4.5 As
expected, spending growth across all retail precincts in the city fell below
the annual rate of inflation of +2.5%. ‘Palmerston North CBD and
Broadway Avenue’ fared the best, with annual spending down 0.2% followed
by ‘Palmerston North City centre’ with a 0.8% decline in spending
over the year.
4.6 Coinciding
with Central District Field Days, the biggest spending week in the city in the
March quarter was the week ending 16 March with a total of $16.8 million spent
in the city over the week. This compares with an average weekly spend of
$15.5 million in the March quarter. The first week of the year is
typically the lowest spending week in the city and this year was no different
with $14.3 million spent in the week ending 5 January 2025.
4.7 The
Quarterly Economic Card Spending Report for March 2025 is attached as
Attachment 2.
5. Economic outlook
5.1 The
latest quarterly data reflects glimmers of improvement in economic conditions
in the city, as the export sector booms, regional recruitment intentions rise,
and commercial investment and non-residential construction activity
lifts. Challenges remain for our sectors most sensitive to weak consumer
confidence and spending, and heightened uncertainty driven by both
international and domestic factors.
5.2 The
current uncertainty was reflected in the latest Monetary Policy Statement
released in May 2025, with comments implying a more cautious approach to
employing interest rate reductions to boost weak economic activity. This
is due to the risk of supply chain disruptions and the potential for upward
pressure on prices, and therefore rising inflation, here in New Zealand.
5.3 On
the other side of the equation, global economic and geopolitical challenges are
arguably more likely to reduce global growth and suppress demand leading to
lower inflation across both the domestic and global economy. This would
lead to the need for lower interest rates to boost spending and support
economic activity across the New Zealand economy. The more
recent tone of the RBNZ highlighted these opposite scenarios while at the same
time, projecting a lower OCR path than recent OCR reviews. Just as global
economic uncertainty is slowing down investment and spending activity
generally, the issue here for the RBNZ is ‘uncertainty’.
5.4 On
the upside, interest rates have fallen 2.25% since their recent peak of 5.5%,
providing relief to households and businesses across the city and national
economy. This will help to boost spending across the economy, supporting
businesses most exposed to the impact of higher interest rates and weak
consumer confidence and spending. The full impact of these lower interest
rates is expected to flow through to households throughout 2025 and into 2026,
with the RBNZ projecting national GDP growth to increase to +2.2% over the year
to March 2026. This clearly signals the expectation of better times
ahead.
5.5 For
the city and the Manawatū Region, the diverse mix of public and private
sector activities continues to support economic activity relative to many other
parts of New Zealand. Signalled investment in some of our large stable
sectors such as health, defence, and education look set to support economic
activity and population levels across the broader economy. Levels of
private investment in warehousing and commercial accommodation also support
opportunities for further investment and visitation to the city. The
completion of large-scale roading projects will also deliver efficiencies and
support flows of goods and services across regional economies, impacting
positively on both business profitability and the wellbeing of people.
The scene is set for economic recovery with an improvement in wider economic
conditions key to the pace of recovery.
5.6 Factors
that influence economic conditions in the city will continue to be reported on
throughout the quarterly economic reporting series.
6. Compliance and administration
|
Does the Council have delegated
authority to decide?
|
Yes
|
|
Are the decisions significant?
|
No
|
|
If they are significant do they
affect land or a body of water?
|
No
|
|
Can this decision only be made
through a 10 Year Plan?
|
No
|
|
Does this decision require consultation
through the Special Consultative procedure?
|
No
|
|
Is there funding in the current
Annual Plan for these objectives?
|
Yes
|
|
Are the recommendations
inconsistent with any of Council’s policies or plans?
|
No
|
|
The
recommendations contribute to: Whāinga 1: He tāone
auaha, he tāone tiputipu
Goal
1: An innovative and growing city
|
|
The recommendations contribute to this
plan:
2.
Mahere whakawhanake ohaoha
2. Economic Development
Plan
The objective is: Support
sustainable business activity and labour market development, in particular,
providing information and education resources to city businesses.
|
|
Contribution to strategic
direction and to social, economic, environmental and cultural well-being
|
Reporting on economic trends
in the city and the longer-term outlook for growth, is important for
encouraging local business to invest, growing their business and attracting
new businesses to the city. It is also important to support businesses
to make informed decisions based on current economic conditions and to
provide information to Councillors to support decision making.
|
|
|
|
Attachments
|
1.
|
Palmerston
North Economic Growth 2025 ⇩ 
|
|
|
2.
|
Palmerston
North Electronic Card Spending Report March 2025 ⇩
|
|
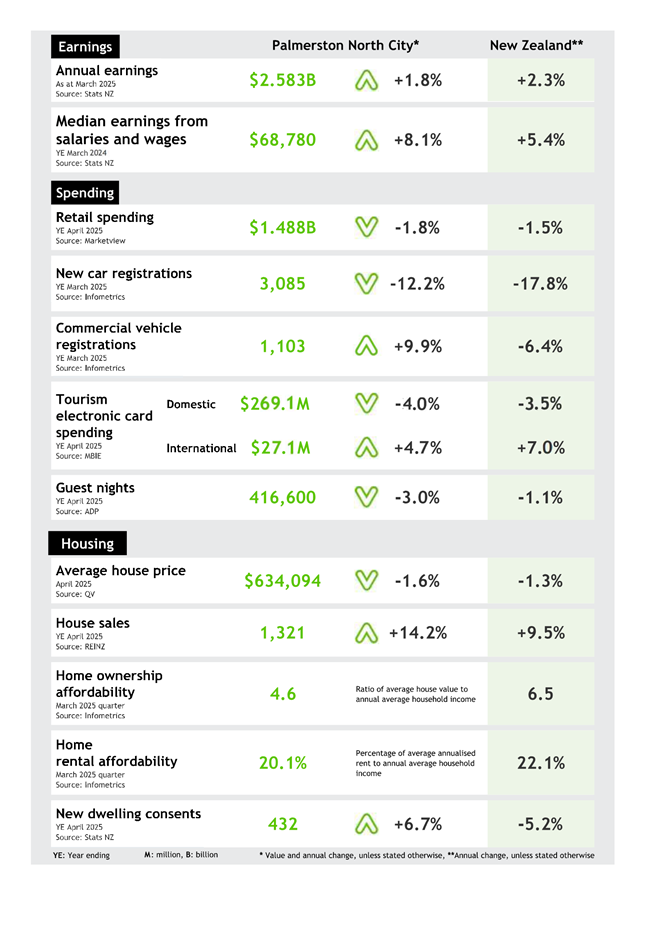
Memorandum
TO: Council
MEETING DATE: 25
June 2025
TITLE: Support
of Remits to Local Government New Zealand 2025 Annual General Meeting
Presented
By: Sarah
Claridge, Governance Advisor
APPROVED BY: Cameron
McKay, General Manager Corporate Services
RECOMMENDATIONS TO
Council
1. That Council
support/ does not support remit 1 on Security System Payments
from Far North District Council and Central Otago District Council.
2. That Council
support/ does not support remit 2 on Improving Joint Management
Agreements from Far North District Council.
3. That Council
support/ does not support remit 3 on Alcohol Licensing Fees from New
Plymouth District Council.
4. That Council
support/ does not support remit 4 on Aligning public and school bus
services from Nelson City Council.
5. That Council
support/ does not support remit 5 on Review of local government
arrangements to achieve better balance from Tauranga City Council.
1. ISSUE
Every year, councils can
endorse remits for consideration at the Local Government New Zealand (LGNZ)
Conference Annual General Meeting (AGM). Remits with sufficient sector support
are considered by all member councils at the LGNZ AGM. Successful remits
will direct LGNZ’s policy advocacy to central government for the
forthcoming year.
This year, the LGNZ AGM will be
held on 16 July 2025 in Christchurch.
The submitted remits for the
AGM are attached.
Council has five votes, but one
presiding delegate who votes on Council’s behalf. Attendees this
year are Waid Crockett (Chief Executive), and councillors Roly Fitzgerald,
Brent Barrett and Orphee Mickalad. The Mayor has delegated the role of
presiding delegate to Councillor Barrett.
This report is an opportunity
for Council to instruct Cr Barrett of its position for each of the 5 remits.
As the remits are from other
councils, Council cannot change the wording of the remits, only confirm whether
or not it is in support.
2. NEXT STEPS
Councillor Barrett, as
presiding delegate, will represent Council at the AGM on 16 July.
3. Compliance and administration
|
Does the Council have delegated
authority to decide?
|
Yes
|
|
Are the decisions significant?
|
No
|
|
If they are significant do they
affect land or a body of water?
|
No
|
|
Can this decision only be made
through a 10 Year Plan?
|
No
|
|
Does this decision require
consultation through the Special Consultative procedure?
|
No
|
|
Is there funding in the current Annual
Plan for these objectives?
|
Yes
|
|
Are the recommendations
inconsistent with any of Council’s policies or plans?
|
No
|
|
The recommendations contribute
to:
All Goals
|
|
The recommendations contribute to this
plan:
14.
Mahere mana urungi, kirirarautanga hihiri
14. Governance and Active
Citizenship Plan
The objective is: Provide
leadership and advocacy for Palmerston North
|
|
Contribution to strategic
direction and to social, economic, environmental and cultural well-being
|
Consideration of remits to
the Local Government New Zealand Annual General Meeting is one way by which
Council contributes to the national policy conversation in the local
government sector.
|
|
|
|
Attachments
|
1.
|
Remits
2025 ⇩
|
|
Committee Work Schedule
TO: Council
MEETING DATE: 25
June 2025
TITLE: Council
Work Schedule
RECOMMENDATION TO Council
1. That Council
receive its Work Schedule dated 25 June 2025
COUNCIL
WORK SCHEDULE 25 June 2025
|
#
|
Estimated
Report Date
|
Subject
|
Officer
Responsible
|
Current
Position
|
Date
of Instruction & Clause
|
|
1
|
6
August
|
Options for property on Ruahine Street
|
GM
Infrastructure
|
|
5 February Clause 14-25
|
|
2
|
25 June
2025
|
Quarter 3 – Economic Update
|
GM Strategic Planning
|
Moved from Economic Growth
|
|
|
3
|
25 June
6 August
2025
|
Public
Spaces: policy and bylaw options
|
GM
Strategic Planning
|
Moved from Strategy & Finance Committee
|
|
|
4
|
25 June 2025
|
Kākātangiata Development Progress Report
|
GM Strategic Planning
|
Moved from Economic Growth
|
|
|
5
|
25 June 2025
|
Deliberation - Kia Toa Lease
|
GM Infrastructure
|
Moved from Strategy & Finance Committee
|
|
|
6
|
6
August
2025
|
Approve
LWDW - Water Services Delivery Plan
|
Chief
Executive
|
|
12 Feb 2025
Clause 18-25
|
|
7
|
25 June 2025
|
Effectiveness of Civics Education
Initiatives – Annual progress report
|
GM Customer & Community
|
|
29 May 2024
Clause 95.29 -24
|
|
8
|
6 August
3 Sept
2025
|
Review
of CEDA Directors Policy
|
GM
Corporate Services
|
Steering group meeting in August
|
2 Oct 2024
Clause 172
|
|
9
|
6
August 2025
|
Report
back on Investment Options for PN Airport.
|
GM
Corporate Services
|
|
6 December 2023
Clause 197-23
|
|
10
|
6
August 2025
|
Civic
and Cultural Precinct Master Plan Steering Group – 6-monthly update
|
GM
Strategic Planning
|
|
Terms
of Reference
|
|
11
|
6
August
2025
|
Appointment
of Trustees on Council Controlled Organisations
|
GM
Corporate Services
|
|
Terms of
Reference
|
|
12
|
3 Sept
8 Oct
2025
|
Review of PNCC Appointment of Directors
Policy.
|
GM Corporate
Services
|
To align with CEDA Appointment Policy Review
|
2 Oct 2024
Clause 172
|
|
13
|
8 Oct
2025
|
Residents
Survey – Action Plan
|
GM
Strategic Planning
|
|
Terms of Reference
|
|
14
|
8 Oct
2025
|
Adopt
Annual Report 2024-25
|
Chief
Executive
|
|
Terms of Reference
|
|
15
|
8 Oct
2025
|
Low Carbon Fund Allocations 2024/25
|
GM
Strategic Planning
|
Moved from Sustainability Committee
|
21 August 2024
Clause 24-24
|
|
16
|
8 Oct
2025
|
Waste Management and Minimisation plan
2019 - annual progress update for 2024/25 FY
|
GM Strategic
Planning
|
Moved from Sustainability Committee
|
9 Sept 2020
Clause 17-20
|
|
17
|
8 Oct
2025
|
Citywide Emissions Inventory 2024 Annual
Report
|
GM
Strategic Planning
|
Moved from Sustainability Committee
|
Climate Change
Plan
Action 3
|
|
18
|
8 Oct
2025
|
PNCC Organisational Emissions Inventory
2024/25 Annual Report
|
GM
Strategic Planning
|
Moved from Sustainability Committee
|
Climate Change
Plan
Action 1
|
|
19
|
TBC
|
Summerhays Reports –
Partnership Models
Expressions of Interest
|
GM
Infrastructure
|
Lying
on the Table
|
1 May 2024
Clause 66-24 and 74 -24
|