TO: Council
MEETING DATE: 12 November 2025
TITLE: Acknowledgement of Service - Councillor Roly Fitzgerald
FROM: The Mayor (Grant Smith)
Summary
The Mayor (Grant Smith) will acknowledge the service of former Councillor Roly Fitzgerald.
NIL
Council
|
Grant Smith (Mayor) |
|
|
Debi Marshall-Lobb (Deputy Mayor) |
|
|
Mark Arnott |
Lorna Johnson |
|
Brent Barrett |
Bonnie Kuru |
|
Rachel Bowen |
Billy Meehan |
|
Vaughan Dennison |
Orphée Mickalad |
|
Lew Findlay (QSM) |
Karen Naylor |
|
Hayden Fitzgerald |
William Wood |
|
Leonie Hapeta |
Kaydee Zabelin |
Council MEETING
12 November 2025
Order of Business
3. Notification of Additional Items
Pursuant to Sections 46A(7) and 46A(7A) of the Local Government Official Information and Meetings Act 1987, to receive the Chairperson’s explanation that specified item(s), which do not appear on the Agenda of this meeting and/or the meeting to be held with the public excluded, will be discussed.
Any additions in accordance with Section 46A(7) must be approved by resolution with an explanation as to why they cannot be delayed until a future meeting.
Any additions in accordance with Section 46A(7A) may be received or referred to a subsequent meeting for further discussion. No resolution, decision or recommendation can be made in respect of a minor item.
4. Declarations of Interest (if any)
Members are reminded of their duty to give a general notice of any interest of items to be considered on this agenda and the need to declare these interests.
To receive comments from members of the public on matters specified on this Agenda or, if time permits, on other Committee matters.
6. Acknowledgement of Service - Councillor Roly Fitzgerald Page 7
Reports
7. Appointment of Committees and Committee Membership Page 9
Memorandum, presented by Hannah White, Manager Governance.
8. Adoption of Elected Members' Remuneration 2025-26 Page 33
Memorandum, presented by Hannah White, Manager Governance and Sarah Claridge, Governance Advisor.
9. Appointment of Council Representatives to the Electoral College for the Central Economic Development Agency and to Local Government New Zealand (Zone 3) Page 41
Memorandum, presented by Sarah Claridge, Governance Advisor.
10. District Licensing Committee - Appointment Process Page 45
Memorandum, presented by Hannah White, Manager Governance.
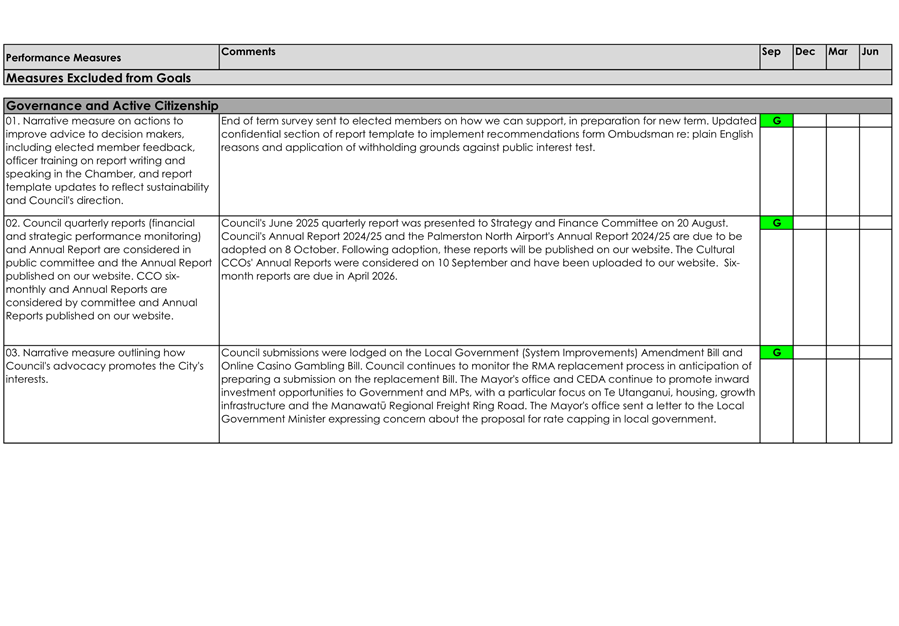
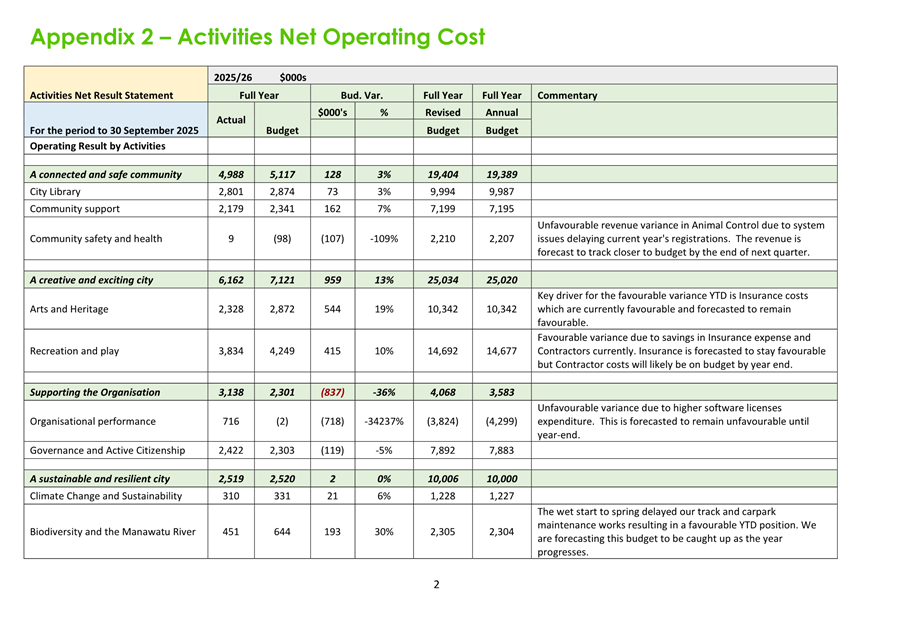
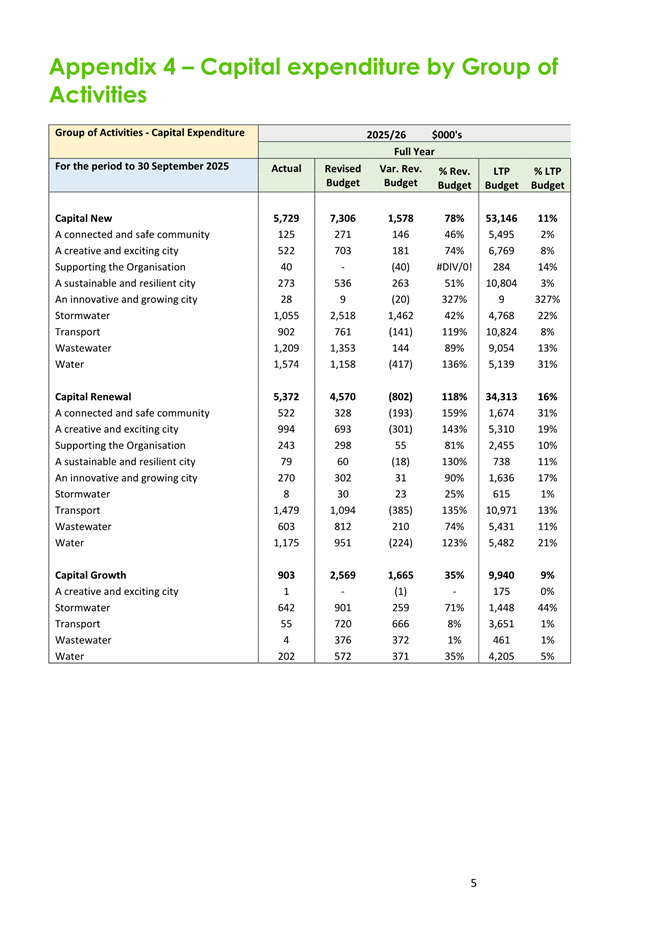
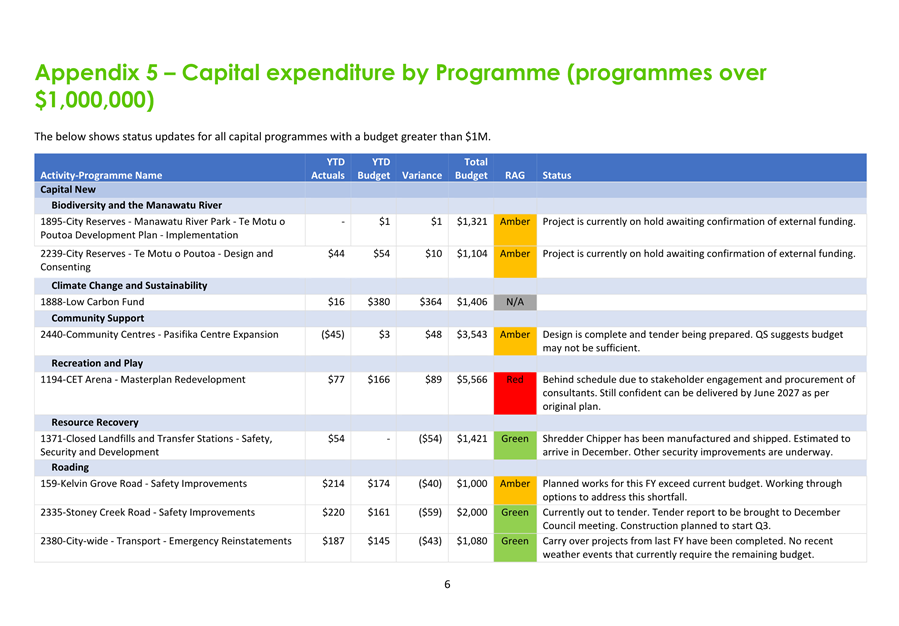
11. Quarterly Performance and Financial Report – period ending 30 September 2025 Page 49
Memorandum, presented by Scott Mancer, Manager - Finance; John Aitken, Manager - Project Management Office; Grace Nock, Manager - Organisational Planning and Performance.
12. Treasury Report - Quarter ending 30 September 2025 Page 121
Memorandum, presented by Steve Paterson, Manager - Financial Strategy.
13. Central Economic Development Agency (CEDA) Annual Report 2024/25 Page 135
Memorandum, presented by David Murphy, General Manager Strategic Planning.
14. Palmerston North Quarterly Economic Update - October 2025 Page 211
Memorandum, presented by Stacey Andrews, City Economist.
15. Annual Summary of Economic Impact and Benefits of Council Supported Events Page 237
Memorandum, presented by Luke McIndoe, Manager Venues + Events Partnerships.
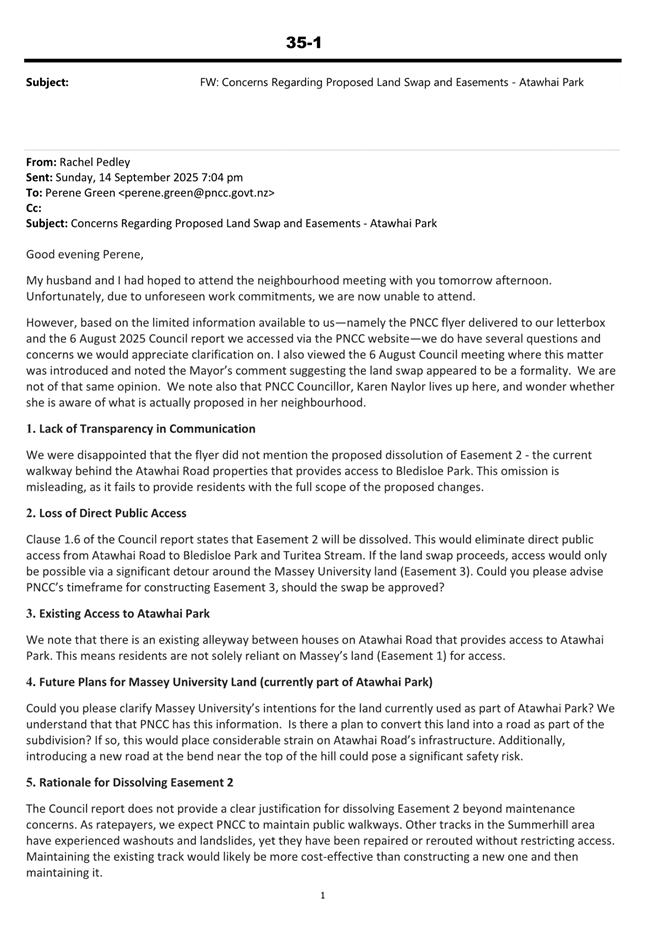
16. Atawhai Park and Walkway - Land Exchange with Massey University: Hearing of Submissions Page 243
17. Atawhai Park and Walkway - Land Exchange with Massey University: Summary of Submissions and Deliberations Page 297
Memorandum, presented by Perene Green, Property Officer and Kathy Dever-Tod, Manager Parks and Reserves.
18. Fitzherbert Park - Proposal to grant Easement to Power: Deliberations Report Page 317
Memorandum, presented by Perene Green, Property Officer.
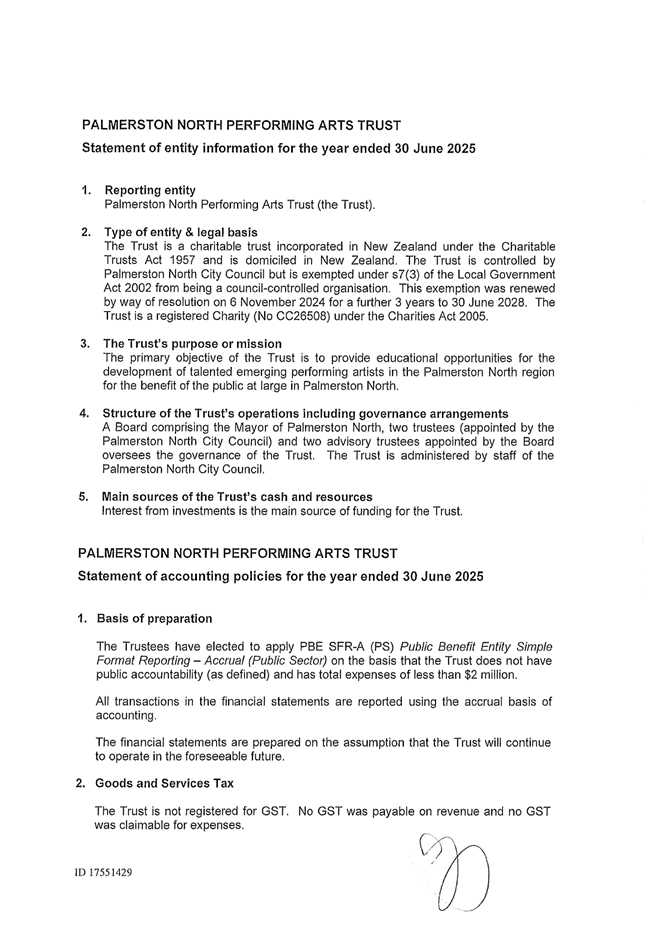
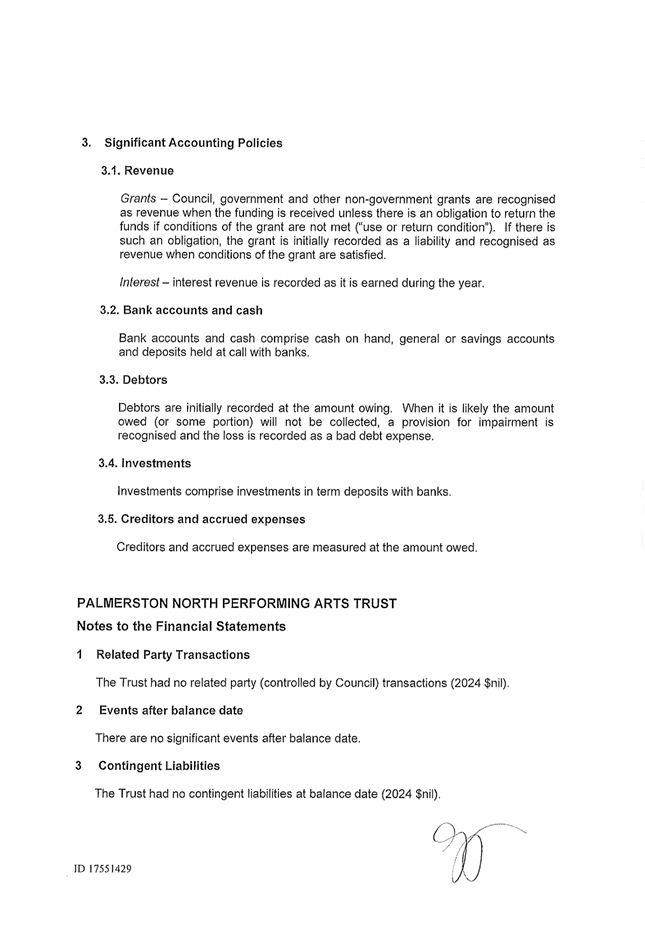
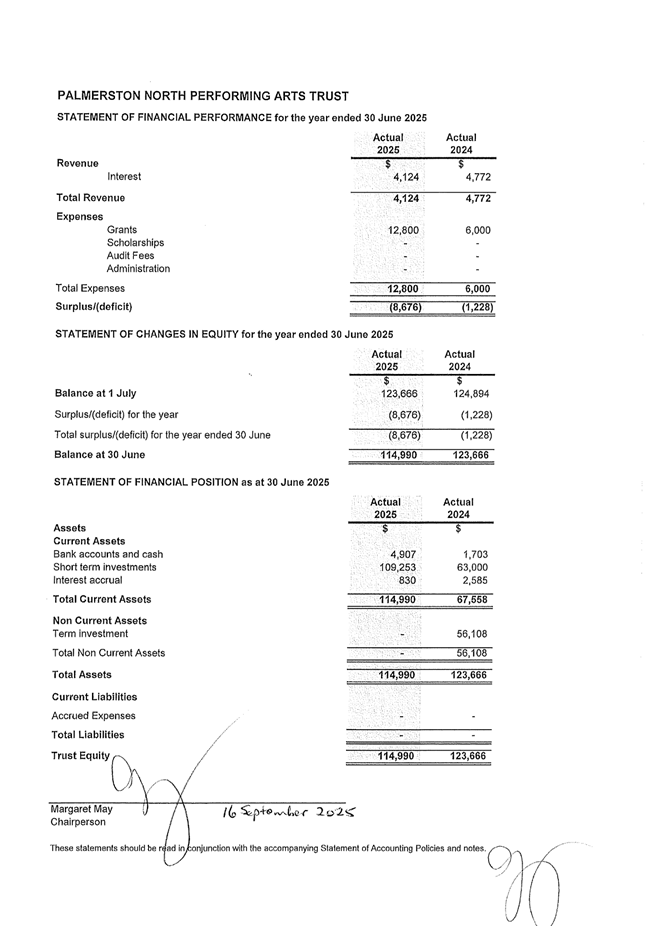
19. Palmerston North Performing Arts Trust - Annual Report and Annual Accounts 2024/25 Page 321
Memorandum, presented by Hannah White, Manager Governance.
20. Karakia Whakamutunga
21. Exclusion of Public
|
|
That the public be excluded from the following parts of the proceedings of this meeting listed in the table below. The general subject of each matter to be considered while the public is excluded, the reason for passing this resolution in relation to each matter, and the specific grounds under Section 48(1) of the Local Government Official Information and Meetings Act 1987 for the passing of this resolution are as follows:
This resolution is made in reliance on Section 48(1)(a) of the Local Government Official Information and Meetings Act 1987 and the particular interest or interests protected by Section 6 or Section 7 of that Act which would be prejudiced by the holding of the whole or the relevant part of the proceedings of the meeting in public as stated in the above table. Also that the persons listed below be permitted to remain after the public has been excluded for the reasons stated. [Add Third Parties], because of their knowledge and ability to assist the meeting in speaking to their report/s [or other matters as specified] and answering questions, noting that such person/s will be present at the meeting only for the items that relate to their respective report/s [or matters as specified].
|
||||||||||||
TO: Council
MEETING DATE: 12 November 2025
TITLE: Acknowledgement of Service - Councillor Roly Fitzgerald
FROM: The Mayor (Grant Smith)
Summary
The Mayor (Grant Smith) will acknowledge the service of former Councillor Roly Fitzgerald.
NIL

TO: Council
MEETING DATE: 12 November 2025
TITLE: Appointment of Committees and Committee Membership
Presented By: Hannah White, Manager Governance
APPROVED BY: Cameron McKay, General Manager Corporate Services
1. That Council note the establishment of Committees made by the Mayor (Table 1), under s41A of the Local Government Act.
2. That Council note the Chairperson appointments made by the Mayor to the Committees (Table 1), under s41A of the Local Government Act.
3. That Council adopt Delegations Manual 2023 Part 4 replacement: Delegations to Committees (Attachment 1) approving the terms of reference and delegations to Committees, including the Mayor’s recommendations for:
a. Deputy Chairpersons and Elected Members’ Committee membership
b. an independent member on the Finance, Performance & Audit Committee
c. up to two Rangitāne o Manawatū representatives on the Arts, Culture & Heritage Committee
4. That Council agree the following change to Delegation 3.1.6: Assignment of Commissioners:
“The Legal Counsel (in liaison with the General Manager – Development & Regulatory, General Manager – Strategic Planning, Manager – Planning Services, Team Leader – Planning Services1 and/or the Principal Planner – Strategic Planning) with input from the Chair and/or Deputy Chair of the Hearings Committee may assign Hearings Commissioners to conduct, consider and determine any matter that requires a hearing or related decision under any of the following acts:
a. Resource Management Act 1991; and
b. Dog Control Act 1996.”
5. That Council adopt Standing Orders 2023 replacement clauses 1.1 Scope and General and 1.5.3 Extension of the Right to Vote (Attachment 2).
6. That Council note that appointment of independent members (if required) will be considered at a later date.
1. ISSUE
To agree a Committee structure and membership to manage Council business for the Council term 2025-28.
The Mayor has exercised his right under Section 41A of the Local Government Act 2002 (LGA) to appoint Chairs and Committees for the Council term. The Mayor has recommended the appointment of Deputy Chairs and Committee membership (as listed in Attachment 1) for Council to approve.
The Terms of Reference and Delegations for each Committee are listed in Attachment 1. Council is asked to approve these for inclusion in the Delegation Manual.
2. Background
2.1 Section 41A (3) of the LGA gives the Mayor the authority:
“(b) to establish committees of the territorial authority:
(c) to appoint the chairperson of each committee established under paragraph (b), and, for that purpose, a mayor—
(i) may make the appointment before the other members of the committee are determined; and
(ii) may appoint himself or herself.”
2.2 The Mayor has established the following Committees and Chairs and recommends the appointment of the deputies listed below.
Table 1: 2025 Committees and Chairs
|
Committee |
Chair |
Deputy Chair |
Meeting Frequency |
|
Community Resilience & Sustainability |
Cr Lorna Johnson |
Cr Brent Barrett |
Monthly |
|
Finance, Performance & Audit |
Cr Vaughan Dennison |
Cr Karen Naylor |
Monthly |
|
Cr Rachel Bowen |
Cr Kaydee Zabelin |
Quarterly |
|
|
Sport & Recreation |
Cr William Wood |
Cr Leonie Hapeta |
Quarterly |
|
Hearings |
Cr Lorna Johnson |
Cr William Wood |
As required |
2.3 If Council does not agree with the decisions the Mayor has exercised under his authority, the Council has the ability to discharge a Chairperson and discharge and reconstitute a Committee as per the Local Government Act 2002 Schedule 7, s. 30 and 31.
2.4 If Council does not agree the Deputy Chairs listed then the Local Government Act Schedule 7, s. 25 requires a competitive system of appointment to be followed as set out in our Standing Orders 3.6.1.
3. Committee Structure, Terms Of Reference and Delegations
3.1 As recommended by the Mayor, Attachment 1 details each Committee’s proposed Terms of Reference (TOR) and delegated authority.
3.2 The Mayor proposes having two Committees: Community Resilience & Sustainability, and Finance, Performance & Audit that meet monthly (nine times a year), and two Committees: Arts, Culture & Heritage, and Sport & Recreation that meet quarterly. A Hearings Committee will meet as required.
3.3 Meetings will occur on Wednesdays.
3.4 The Terms of Reference have been designed to align with expected amendments to the Local Government Act, particularly around the provision of core services local authorities are to provide. All Committees have been allocated delegation to agree relevant draft bylaws and policies for public consultation and refer items to the Annual Plan (Budget).
3.5 Below is a summary of each Committee’s terms of reference and any additional delegations.
Community Resilience & Sustainability Committee
3.6 The Committee’s focus is on local public services: libraries, civil defence emergency management and waste management. The Committee will receive presentations from Sector Leads and Reference Groups and will oversee Council’s performance of regulatory functions and environmental indicators.
3.7 The Committee’s delegations include approving community leases and the annual Dog Report.
Finance, Performance & Audit Committee
3.8 The Finance, Performance & Audit Committee will be responsible for infrastructure and economic activity. It will monitor organisational performance through regular financial and non-financial reporting, oversee the Council’s business assurance function and Council’s responsibilities for managing risk and health and safety reporting.
3.9 The Committee’s delegations extend to approving fees and charges where consultation is not otherwise required, acting as shareholder for the relevant CCOs (listed in its terms) and agreeing contracts to the value of $3M that are otherwise outside of the Chief Executive’s delegation (for projects agreed in the Annual Plan (Budget) or Long-Term Plan).
Arts, Culture & Heritage Committee
3.10 The Arts, Culture & Heritage Committee will be responsible for local public services: museums and associated heritage facilities. It will monitor performance of the cultural CCOs, oversee the establishment of the new Te Motu o Poutoa/ Anzac Park CCO, and receive presentations for the Heritage Reference Group and relevant sector leads.
3.11 The Committee has delegation to act as the shareholder for the cultural CCOs.
Sport & Recreation Committee
3.12 The Sport & Recreation Committee’s focus will be on local infrastructure: reserves and other recreational facilities. It will monitor programmes from the Play and Recreation Plan under Goal 2: A creative and exciting city.
3.13 The Committee has delegation to monitor the Sport Manawatū contract and to agree leases for sport clubs.
Hearings Committee
3.14 The Hearings Committee will receive reports on upcoming hearing and regulatory matters.
3.15 Delegations include determining any bus shelter hearing decisions. The Legal Counsel will consult the Chair of the Committee before assigning Commissioners to sit on a hearings panel.
4. quasi-judicial Committees
4.1 Council also has quasi-judicial bodies that are governed under other legislation. These are:
Table 2: Quasi-judicial Bodies
|
Body |
Purpose |
|
District Licensing Committee |
Set up under the Sale of Alcohol Act 2012. Responsible for issuing liquor licenses to premises and management certificates to individuals. Panels are assigned from the Council-approved District Licensing Committee list, some or all of whom can be Elected Members and/or appointed community members. |
|
Hearings Panels |
Set up under the: 1. Resource Management Act 1991 Responsible for determining resource consents and District Plan changes. 2. Dog Control Act 1996 Responsible for determining appeals of a dangerous or menacing dog classification. Panels are assigned from the schedule of Council-approved RMA commissioners, some or all of whom can be Elected Members and/or an independent commissioner. |
4.2 Council’s Standing Orders (meeting procedures) do not apply to the bodies listed in Table 2 above. Any delegations from Council are set out in the Delegations Manual.
4.3 A separate report to this same meeting addresses the appointment process for the District Licensing Committee. Appointments will be brought to Council for approval in due course.
4.4 Hearings panels will be assigned from Council’s previously approved schedule of independent RMA Commissioners and Elected Members with Making Good Decisions certification, listed as members of the Hearings Committee.
5. CHIEF Executive’s performance review
5.1 The function of guiding the Chief Executive’s performance review process will be led by the Deputy Mayor and supported by the Mayor, with external Human Resource advice as needed. The General Manager People & Capability will provide internal administrative support as appropriate.
5.2 All recommendations will continue to be brought to full Council for decision.
6. MEMBERSHIP OF COmmittees AND rights of members
6.1 Elected Members have been allocated membership of Committees as set out in Attachment 1.
6.2 Members of Committees are expected to attend Committee meetings. Attendance of Committee members will be recorded.
6.3 Recommendations of Committees are agreed by the elected full Council.
6.4 The Local Government Act allows for independent members to be appointed to Committees where a person has the skills, attributes or knowledge that will assist the work of the Committee.
6.5 The Office of the Auditor General recommends an independent chairperson as a method to promote free and frank debate and to provide confidence in the objectiveness of the advice and assurance. There has been an independent member and/or Chair on the committee responsible for the audit and risk function for the previous two terms.
6.6 The kawenata (partnership agreement) between Palmerston North City Council and Rangitāne o Manawatū sets out that there would be Rangitāne representation on any decision-making body with regard to Te Motu o Poutoa. For the last two terms, this has occurred on the Rangitāne o Manawatū Committee.
6.7 Any actual appointment of independent members will be brought to Council in due course.
Review of Standing Orders
6.8 The Government is in the process of developing a set of Standing Orders which will be compulsory for all local authorities to follow, should the Local Government Systems Improvements Bill become law. One of the likely changes for Palmerston North City Council is that there will be a stricter interpretation of Committee membership than our current Standing Orders allow for. This may mean that only members of a Committee will have full voting and participation rights. Elected Members who are not a member of a Committee might be able to ask questions of an item, with the discretion of the Chair, but will not be able to debate or vote on said item.
6.9 Feedback is currently being sought on the Government’s Standing Orders, with the final version likely to be rolled out to local authorities in the first half of 2026. Until then, Council’s current Standing Orders remain in place.
6.10 Officers do however recommend a small amendment to the current Standing Orders (Attachment 2) to update clauses 1.1 and 1.53 to align with the list of Committees for the 2025-28 term, ie. allowing that non-committee members (Elected Members) have full participation and voting rights. It should be noted that under the Local Government Act, any amendment to the Standing Orders requires a 75% majority of members present.
7. NEXT STEPS
7.1 Committee Terms of Reference and delegations will replace Part 4 of the Delegations Manual and be published.
7.2 Chairs positions will be included in the decisions regarding allocation of the remuneration pool.
7.3 Committee work schedules will be populated according to the Terms of Reference for each Committee and discussed with Chairs.
7.4 With the significant changes to Council’s responsibilities towards waters’ infrastructure and resource consenting occurring this term, the Committee structure will be reviewed in 18 months’ time to ensure it aligns with the needs of the Council following the creation of the joint water entity.
8. Compliance and administration
|
Does the Council have delegated authority to decide? |
Yes |
|
|
Are the decisions significant? |
No |
|
|
If they are significant do they affect land or a body of water? |
No |
|
|
Can this decision only be made through a 10 Year Plan? |
No |
|
|
Does this decision require consultation through the Special Consultative procedure? |
No |
|
|
Is there funding in the current Annual Plan for these actions? |
Yes |
|
|
Are the recommendations inconsistent with any of Council’s policies or plans? |
No |
|
|
Delegations Policy updated where relevant to ensure alignment. |
|
|
|
The recommendations contribute to: Whāinga 1: He tāone auaha, he tāone
tiputipu
Whāinga 3: He hapori tūhonohono, he hapori
haumaru Whāinga 4: He tāone toitū, he tāone
manawaroa |
||
|
The recommendations contribute to this plan: 14. Mahere mana urungi, kirirarautanga hihiri 14. Governance and Active Citizenship Plan The objective is: Provide clear and accessible information and opportunities for community input into council decisions. |
||
|
Contribution to strategic direction and to social, economic, environmental and cultural well-being |
Committee structure is clearly defined and understood to allow for effective and efficient decision making to occur. |
|
|
1. |
Delegations to Council and
Committees: Structure, Membership, Terms of Reference and Delegations ⇩ |
|
|
2. |
Amendment to Standing Orders
2023 ⇩ |
|

TO: Council
MEETING DATE: 12 November 2025
TITLE: Adoption of Elected Members' Remuneration 2025-26
Presented By: Hannah White, Manager Governance and Sarah Claridge, Governance Advisor
APPROVED BY: Cameron McKay, General Manager Corporate Services
1. That Council agree (Option 1 or Option 2 or Option 3) for Elected Members’ Remuneration for 2025-2028.
2. That Council approve the information relating to the positions of additional responsibility Table 2 and Table 3 (if applicable) be sent to the Remuneration Authority.
3. That Council note that recommendation 1 will take effect from either the date the new Council came into office (17 October 2025) or the date after the positions were established (6 November and 13 November 2025).
1. ISSUE
1.1 Every year, the Remuneration Authority reviews and sets the salary for the Mayor, a minimum salary to be paid to Councillors and the total governance remuneration pool for each council. Council is required to fully allocate its pool amongst all members.
1.2 This report provides several options for Elected Members to consider how the additional remuneration in the pool should be divided between members.
2. BACKGROUND
2.1 The Remuneration Authority is legally responsible for setting Council’s remuneration pool, the Mayor’s salary, and what expenses and allowances (and the rates of allowance) Elected Members can claim. Elected Members’ expenses and allowances will be considered in December 2025.
2.2 The remuneration payable to the Mayor ($172,563 per annum) has been set by the Authority, from which a deduction is made for personal use of a motor vehicle. The Mayor’s remuneration is separate to the Remuneration Pool. As such, any Committees chaired by the Mayor are not included in the remuneration pool.
Timeframes
2.3 To receive the full remuneration by January 2026, Council must inform the Remuneration Authority how it wishes to divide the remuneration pool by 14 November 2025. Upon approval from the Remuneration Authority, remuneration will be backdated so that:
· for a Councillor with no additional responsibilities, remuneration will take effect from the day after the official result of the 2025 election was declared (17 October 2025);
· for Deputy Mayor, remuneration will take effect from the day after the appointment (6 November 2025); and
· for Councillors with additional responsibilities, remuneration will take effect from the day after the Council formally voted on those positions (13 November 2025).
2.4 Until the Remuneration Authority gazettes the Council’s proposed remuneration rates, all Councillors will receive the minimum Councillors’ remuneration of $53,959. If deadlines are met, Council’s remuneration will be gazetted on Thursday 18 December 2025 and Elected Members should receive their backdated remuneration in January 2026.
3. Distribution of remuneration pool
3.1 For Palmerston North City, the total pool available for remuneration for Councillors is $971,282. After allowing for a minimum annual salary of $53,959 which is required to be paid to each Councillor, there remains $161,877 which is required to be distributed to some or all Councillors.
3.2 The remaining remuneration ($161,877) could be used for the remuneration of Councillors who take on extra responsibilities (for example, the Chairs and/or Deputy Chairs) and/or it could be used to increase the base payment for all Councillors.
3.3 When this matter was considered by Elected Members at a workshop on 30 October 2025, there was discussion on the following points:
· total workload between chairing tasks and other representative work such as external appointments and general attendance at community events should be as even as possible;
· the base rate for all Councillors should increase to provide for a flatter structure to reflect this principle;
· the Deputy Mayor’s workload deserved higher remuneration;
· there should be a difference between monthly and quarterly Chairs to recognise frequency and associated preparation; and
· whether the preparation workload of Committee Deputies was sufficiently greater than a member of the Committee to allocate additional remuneration.
3.4 Each option below increases the base rate for each Councillor to approximately $63K, adjusts the Deputy Mayor’s salary to between $70-73K and retains additional remuneration for a Committee Chair to recognise responsibility and time commitments.
Option 1: Additional Pay for Chair of Hearings Committee
Increase the base pay of each Councillor to $63,100 (+$9,141 of minimum), additional pay to Deputy Mayor and Committee Chairs.
|
Position |
No. |
Base Pay |
Extra Pay |
Total Pay |
|
Deputy Mayor |
1 |
$63,100 |
$10,000 |
$73,100 |
|
Chair of Committee – monthly |
1 |
$63,100 |
$5,000 |
$68,100 |
|
Chair of Committee – monthly and Hearings Committee |
1 |
$63,100 |
$5,762 |
$68,862 |
|
Chair of Committee – quarterly |
2 |
$63,100 |
$2,000 |
$65,100 |
|
Councillor with no additional responsibilities |
10 |
$63,100 |
N/A |
$63,100 |
3.5 Option 1 provides additional remuneration for the Chair of the Hearings Committee, to recognise the additional responsibility and workload.
Option 2: Additional Pay for Deputy Chairs of Committees
Increase the base pay of each Councillor to $63,000 (+$9,041 of minimum), additional pay to Deputy Mayor, Committee Chairs and Deputies.
|
Position |
No. |
Base Pay |
Extra Pay |
Total Pay |
|
Deputy Mayor |
1 |
$63,000 |
$10,262 |
$73,262 |
|
Chair of Committee – monthly |
2 |
$63,000 |
$5,000 |
$68,000 |
|
2 |
$63,000 |
$2,000 |
$65,000 |
|
|
Deputy Chair of monthly and quarterly Committees |
4 |
$63,000 |
$500 |
$63,500 |
|
Councillor with no additional responsibilities |
6 |
$63,000 |
N/A |
$63,000 |
3.6 Option 2 provides for Deputies of Committees to be paid additional remuneration. Deputy Chairs of monthly and quarterly Committees have been allocated the same rate to acknowledge that the additional workload is likely to equally come from requested representation at community events and meetings related to the terms of reference of each Committee.
3.7 To keep the base pay high, the additional remuneration for the Chair and Deputy Chair of the Hearing Committee has not been included to enable Deputies of monthly and quarterly Committees to be remunerated.
Option 3: Higher base pay for all Councillors
Increase the base pay of each Councillor to $63,500 (+$9,541 of minimum), additional pay to Deputy Mayor, and Committee Chairs.
|
Position |
No. |
Base Pay |
Extra Pay |
Total Pay |
|
Deputy Mayor |
1 |
$63,500 |
$6,500 |
$70,000 |
|
Chair of Committee – monthly |
2 |
$63,500 |
$4,131 |
$67,631 |
|
Chair of Committee – quarterly |
2 |
$63,500 |
$2,000 |
$65,000 |
|
Councillor with no additional responsibilities |
10 |
$63,500 |
N/A |
$63,500 |
3.8 Option 3 offers the highest base pay for all Councillors and a flatter structure. To enable this, remuneration for the Chair of Hearings Committee has not been included, noting that the Chair is paid when acting in their capacity of Chair of any panel.
4. roles of responsibility
4.1 The Remuneration Authority has requested a brief description to be provided for each position of responsibility, i.e. specifying the additional responsibilities over and above the base Councillor role, including duties, delegations, deputising and reporting obligations and the extra time involved in carrying out the additional responsibilities.
Table 1: Roles of Responsibility
|
Additional responsibilities |
|
|
Deputy Mayor |
Chief Executive Performance Management and review Deputising for the Mayor when the Mayor is absent for Committee Deputising for the Mayor at community events Deputising for the Mayor when the Mayor is absent for a Civil Defence Emergency Assuming any powers of the Mayor if the Mayor is incapacitated or unavailable Attending Draft Agenda meetings of Committees Spokesperson for media at request of Mayor Weekly meetings with Mayor Assume any appointments or responsibilities as set out in Policy and/or Delegations
Estimated 45 hours/month |
|
Chair of Committee |
Chairing Committee of responsibility in a fair, objective and efficient manner Upholding Council’s meeting procedures and agreed principles Attending Chairs meetings Attending Draft Agenda meetings for Committee of responsibility Representing the Council at community events relating to Committee responsibilities Spokesperson for media on Committee of responsibility matters Regular liaison with Deputy Chair and Lead Officer for Committee of responsibility Assume any appointments or responsibilities as set out in Policy and/or Delegations
Estimated 30 hours/month- for monthly Committees Estimated 15 hours/month- for quarterly Committees |
4.2 If Members would like to provide additional remuneration to Deputy Chairs (see Option 2 above), Table 2 outlines proposed roles of responsibility for a Deputy Chair.
Table 2: Additional Responsibility for Deputy Chair of a Monthly/Quarterly Committee
|
Position |
Additional Responsibilities |
|
Deputy Chair of Committee |
Attending community events relating to Committee responsibilities Deputising for the Chair at community events relating to Committee responsibilities Deputising for the Chair when the Chair is absent for Committee Supporting the Chair to uphold Council’s meeting procedures and agreed principles Attending Draft Agenda meetings for Committee of responsibility
Estimated 5 hours/month |
5. NEXT STEPS
Officers will submit necessary documentation to the Remuneration Authority tomorrow.
Once the Council’s remuneration has been gazetted by the Remuneration Authority, remuneration will be backdated and adjusted as appropriate.
6. Compliance and administration
|
Does the Council have delegated authority to decide? |
Yes |
|
|
Are the decisions significant? |
No |
|
|
If they are significant do they affect land or a body of water? |
No |
|
|
Can this decision only be made through a 10 Year Plan? |
No |
|
|
Does this decision require consultation through the Special Consultative procedure? |
No |
|
|
Is there funding in the current Annual Plan for these actions? |
Yes |
|
|
Are the recommendations inconsistent with any of Council’s policies or plans? |
No |
|
|
The recommendations contribute to: Whāinga 1: He tāone auaha, he tāone
tiputipu Whāinga 2: He tāone whakaihiihi, tapatapahi ana Whāinga 3: He hapori tūhonohono, he hapori haumaru
Whāinga 4: He tāone toitū, he tāone
manawaroa |
||
|
The recommendations contribute to this plan: 14. Mahere mana urungi, kirirarautanga hihiri 14. Governance and Active Citizenship Plan The objective is: Base our decisions on sound information and advice. |
||
|
Contribution to strategic direction and to social, economic, environmental and cultural well-being |
Appropriate remuneration supports effective decision makers. |
|
NIL

TO: Council
MEETING DATE: 12 November 2025
TITLE: Appointment of Council Representatives to the Electoral College for the Central Economic Development Agency and to Local Government New Zealand (Zone 3)
Presented By: Sarah Claridge, Governance Advisor
APPROVED BY: Cameron McKay, General Manager Corporate Services
1. That Council approve the Mayor’s recommendation for the appointments of Council representatives to:
a. the Central Economic Development Agency Electoral College: The Mayor, Councillors Vaughan Dennison and Leonie Hapeta.
b. The Local Government New Zealand (Zone 3): The Mayor, Deputy Mayor (as proxy for the Mayor as necessary), Councillors Rachel Bowen, Vaughan Dennison, Karen Naylor and Orphée Mickalad.
1. ISSUE
A recruitment process for board members of the Central Economic Development Agency (CEDA) is underway. Council’s three representatives for the CEDA Electoral College are required today to ensure board appointments are completed before 31 December 2025.
The first Local Government New Zealand (Zone 3) meeting of this triennium is to be hosted by Horizons Regional Council in Palmerston North on 20 and 21 November 2025. Appointments will allow the members the delegated authority to act on behalf of the Council.
Thus, this memorandum seeks Council approval of Palmerston North City Council appointments to the Electoral College and to Local Government New Zealand (Zone 3).
2. BACKGROUND
Every triennium, Council appoints representatives to a number of internal and external bodies. Appointments are for the Council term though members can resign from a role earlier if necessary. The Council’s Appointment of Directors and Trustees Policy[1] outlines the term of appointment, remuneration and process of appointment to bodies.
Council representatives receive no additional remuneration for this work though expenses might be available for attendance of events outside of the Palmerston North City boundary, as detailed in the Expenses & Allowances Policy on the agenda for this meeting.
CEDA Electoral College
CEDA is responsible for promoting the economic development of the Manawatū region. It is a jointly owned organisation between Manawatū District Council and Palmerston North City Council. The CEDA Electoral College is responsible for conducting the recruitment process and recommending a preferred director(s) for the councils to appoint. Authority to act is outlined in section 3.3 of the CEDA Appointment of Directors’ Policy.
In the 2025-2028 term of Council, Manawatū District Council are responsible for administering any joint council arrangements for CEDA and will act as the Secretariat for the Electoral College.
The timeline is as follows:
Advertising 6 October-9 November 2025
Interviews 17 November 2025
Appointment 10 December 2025
Palmerston North has 3 positions on the Electoral College (the Mayor + 2 Councillors).
The Mayor recommends:
· Councillor Vaughan Dennison
· Councillor Leonie Hapeta
Local Government New Zealand (Zone 3)
A pool of five Elected Members will be appointed, from which members will be chosen to represent Palmerston North at Zone 3 meetings.
These usually occur twice per calendar year and are hosted by councils throughout Zone 3 (mid/lower North Island region).
The Mayor recommends himself and:
· Councillor Rachel Bowen
· Councillor Vaughan Dennison
· Councillor Karen Naylor
· Councillor Orphée Mickalad
3. NEXT STEPS
From the appointed membership: the Mayor, Councillors Naylor and Mickalad will attend the Zone 3 November meeting as representatives of Palmerston North City Council. The Deputy Mayor and Councillors Barrett, Zabelin and Kuru will also take the opportunity to attend since the gathering is in Palmerston North.
Appointed members to the Electoral College will receive applications of those who have applied ready for shortlisting.
Appointments of Council representatives to all other bodies will come to Council in early December.
4. Compliance and administration
|
Does the Council have delegated authority to decide? |
Yes |
|
|
Are the decisions significant? |
No |
|
|
If they are significant do they affect land or a body of water? |
No |
|
|
Can this decision only be made through a 10 Year Plan? |
No |
|
|
Does this decision require consultation through the Special Consultative procedure? |
No |
|
|
Is there funding in the current Annual Plan for these actions? |
Yes |
|
|
Are the recommendations inconsistent with any of Council’s policies or plans? |
No |
|
|
The recommendations contribute to: Whāinga
1: He tāone auaha, he tāone tiputipu Whāinga 2: He tāone whakaihiihi, tapatapahi ana Whāinga 3: He hapori tūhonohono, he hapori
haumaru Whāinga 4: He tāone toitū, he tāone
manawaroa |
||
|
The recommendations contribute to this plan: 14. Mahere mana urungi, kirirarautanga hihiri 14. Governance and Active Citizenship Plan The objective is: Provide leadership and advocacy for Palmerston North.
|
||
|
Contribution to strategic direction and to social, economic, environmental and cultural well-being |
Appointments to represent Council at Local Government New Zealand ensures Palmerston North benefits from and contributes to sector knowledge at a national level. Appointments to the Electoral College ensure continuation of the shared governance of CEDA. |
|
NIL

TO: Council
MEETING DATE: 12 November 2025
TITLE: District Licensing Committee - Appointment Process
Presented By: Hannah White, Manager Governance
APPROVED BY: Cameron McKay, General Manager Corporate Services
1. That the Council instruct the Chief Executive to commence a recruitment process for Palmerston North City Council’s list of approved District Licensing Committee members.
2. That the Council agree the Mayor, Deputy Mayor, Legal Counsel and Susan Baty, form the selection panel to finalise selection criteria, shortlist and interview candidates and make recommendations to the Council regarding final appointments to the District Licensing Committee list.
1. ISSUE
1.1 The terms of several current District Licensing Committee (DLC) members are due to expire by March 2026.
1.2 A recruitment process will need to be undertaken to ensure that the Committee can continue without disruption.
1.3 This report recommends that a recruitment process be undertaken to add to Palmerston North City Council’s list of approved DLC members. Interested members of the community and Elected Members can apply to be appointed as a member of the list.
2. BACKGROUND
2.1 Palmerston North City Council appoints individuals to a list, for a period of up to 5 years, from which is drawn the DLC membership to hear and make independent and impartial quasi-judicial decisions on applications for alcohol licences (including temporary, variations and renewals) and manager’s certificates, as required by the Sale and Supply of Alcohol Act 2012.
2.2 Anyone wanting to sell at retail or supply alcohol in Palmerston North must apply to Council for a licence. The DLC decides all applications for licences and manager’s certificates by considering the application, agency reports, evidence and submissions presented to it against the criteria in the Act and any relevant case law. The Committee then objectively determines facts and draws conclusions from them to make its decision. Decisions are subject to appeal at the Alcohol Regulatory & Licensing Authority and judicial review.
2.3 Sections 189-193 of the Act set out the required composition of licensing committees. Each Committee consists of three members from the Council’s list maintained under section 192, including one member as the Chairperson. The Chairperson can be an Elected Member, or an appointed Commissioner.
2.4 Council is also able to appoint an Elected Member to be both a member of the DLC and the Deputy Chairperson to act in place of the Chair (Commissioner) if they are unavailable.
2.4 The Act sets out eligibility for the list as follows:
a) Members must have experience relevant to alcohol licensing matters;
b) Members must not be appointed if they have such an involvement or appearance of involvement with the alcohol industry that they could not perform their duties without actual or perceived bias, or the person is a Police officer, a Medical Officer of Health, an Alcohol Licensing Inspector or an employee of a territorial authority; and
c) Commissioners must be of good standing in the community and have the necessary knowledge, skill, and experience relating to matters that are likely to come before the committee.
Current Membership and Appointment Process
2.5 Current terms of list members expire on the following dates:
|
Name |
Position |
DLC List member since |
Expiry |
|
Aleisha Rutherford |
Chair, Commissioner |
November 2020 |
30 Nov 2026 |
|
Vicki Beagley |
Chair, Commissioner |
October 2016 |
30 Nov 2026 |
|
Stewart Davies |
List member |
November 2020 |
30 Nov 2026 |
|
Chantelle Fraser-Clark |
List member |
November 2023 |
31 March 2026 |
|
Antonia Crisford |
List member |
November 2023 |
31 March 2026 |
2.5 Councillor Orphée Mickalad was appointed as Deputy Chair for the previous term of Council. This appointment expired on 11 October 2025.
2.6 The Appointment of Director’s Policy 2022 (pages 14-16) sets out the process for appointing to the DLC list.
2.7 The Policy outlines the members of the Selection Panel, one of which must be an independent member (who has relevant expertise of alcohol related matters). Officers recommend that the former chair of the DLC, Susan Baty (member 2014–2022) be appointed to the Selection Panel.
2.8 Officers recommend that we open expressions of interest from Elected Members directly, with appointments prior to Christmas, and then advertise for community appointments early in the new year. As the two Commissioners’ terms expire in November 2026, a further recruitment process will commence in August 2026.
2.9 The Selection Panel will therefore be needed to meet three times in:
· December 2025 (to interview interested and eligible Elected Members);
· February 2026 (to shortlist and interview any community members); and
· September 2026 (to interview community or Elected Members interested and eligible for the Chair/Commissioner role(s)).
Remuneration and Workload
2.10 Members are paid $51 per hour and the Chair, $78 per hour. These rates are set by the Ministry of Justice.
2.11 Elected Members who participate in an alcohol licensing hearing or meeting may claim the payment in addition to their Council remuneration.
2.12 Workload requires fortnightly meetings (via Teams) and attendance at hearings which can be 1-2 days per month.
3. NEXT STEPS
3.1 Undertake the recruitment process outlined above.
3.2 Elected Members interested in being on the DLC should send an expression of interest to the Mayor before Close of Business 19 November 2025, with interviews for Elected Members being scheduled in the weeks following.
3.3 Shortlisting and the interview process for community members will occur in February 2026. Recommendations for appointment will be brought to the February 2026 Council meeting.
3.4 Following appointment, the newly established list of approved members will be published on the website.
3.5 Appropriate and ongoing training will be made available to members.
4. Compliance and administration
|
Does the Council have delegated authority to decide? |
Yes |
|
|
Are the decisions significant? |
No |
|
|
If they are significant do they affect land or a body of water? |
No |
|
|
Can this decision only be made through a 10 Year Plan? |
No |
|
|
Does this decision require consultation through the Special Consultative procedure? |
No |
|
|
Is there funding in the current Annual Plan for these actions? |
No |
|
|
Are the recommendations inconsistent with any of Council’s policies or plans? |
No |
|
|
The recommendations contribute to: Whāinga 2: He tāone whakaihiihi, tapatapahi ana
Whāinga 3: He hapori tūhonohono, he hapori
haumaru |
||
|
The recommendations contribute to this plan: 14. Mahere mana urungi, kirirarautanga hihiri 14. Governance and Active Citizenship Plan The objective is: Base our decisions on sound information and advice. |
||
|
Contribution to strategic direction and to social, economic, environmental and cultural well-being |
Ensuring appointment processes are fair, transparent and free from conflicts of interest (real or perceived) contributes to Council’s reputation for good governance and strong community wellbeing outcomes. |
|
Nil

TO: Council
MEETING DATE: 12 November 2025
TITLE: Quarterly Performance and Financial Report – period ending 30 September 2025
Presented By: Scott Mancer, Manager - Finance; John Aitken, Manager - Project Management Office; Grace Nock, Manager - Organisational Planning and Performance
APPROVED BY: Cameron McKay, General Manager Corporate Services
RECOMMENDATION(S) TO COMMITTEE
1. That Council receive the report titled ‘Quarterly Performance and Financial Report – period ending 30 September 2025’, and related attachments, presented on 12 November 2025.
1. ISSUE
To provide an update on the performance and financial achievements of the Council for the period ending 30 September 2025.
2. BACKGROUND
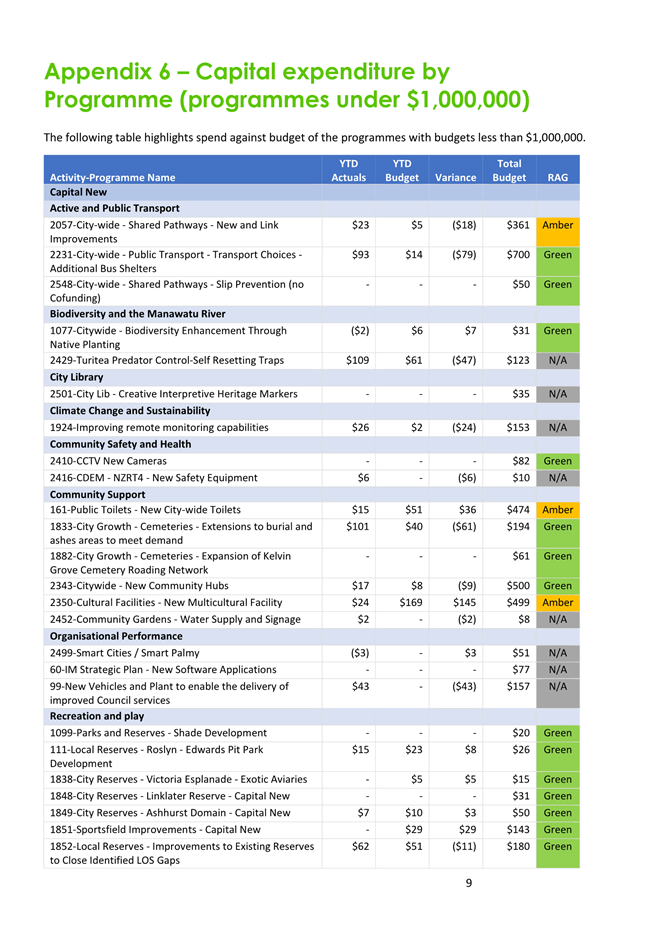
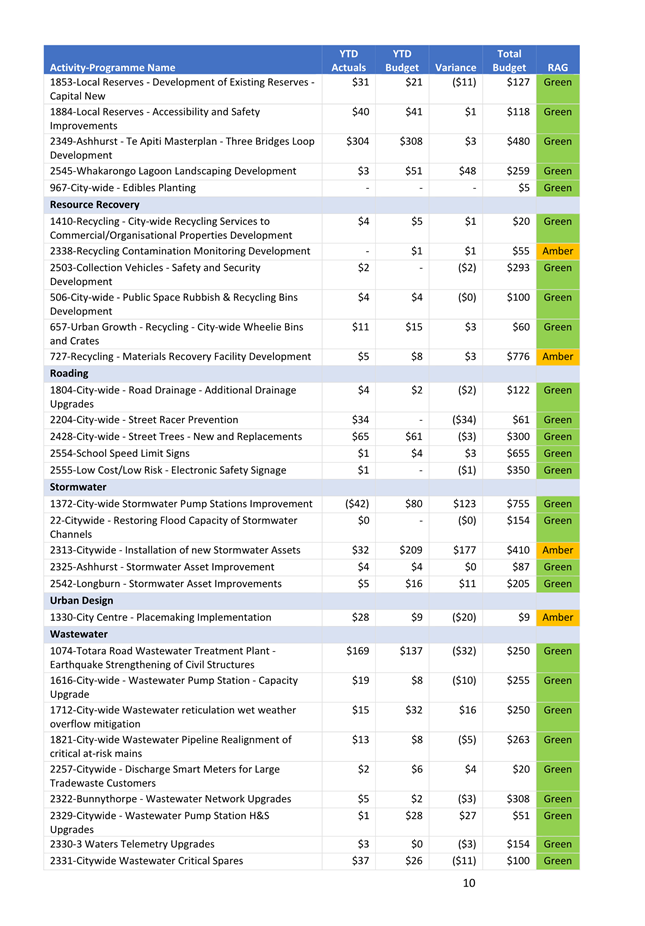
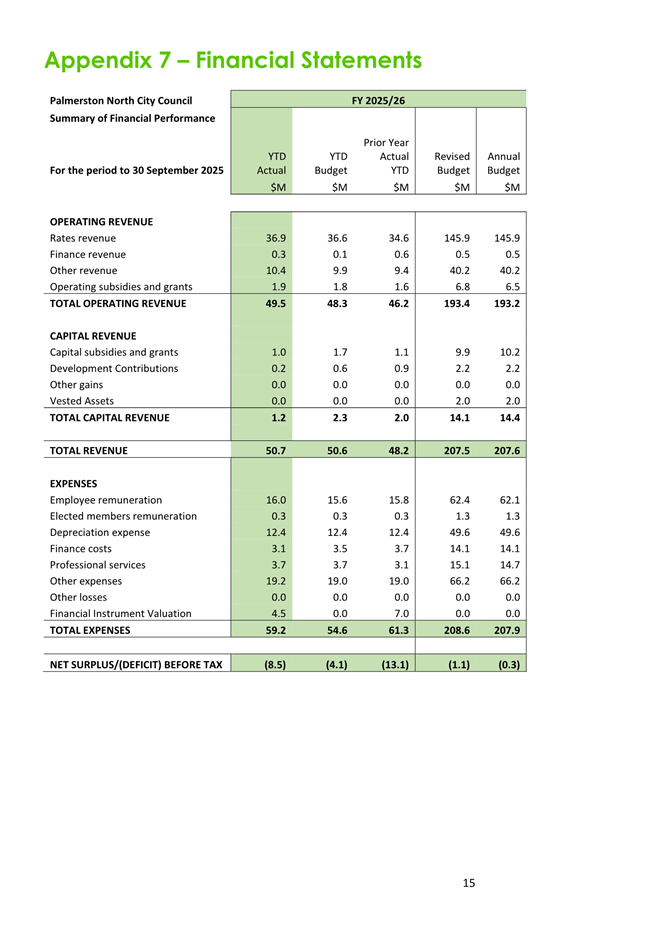
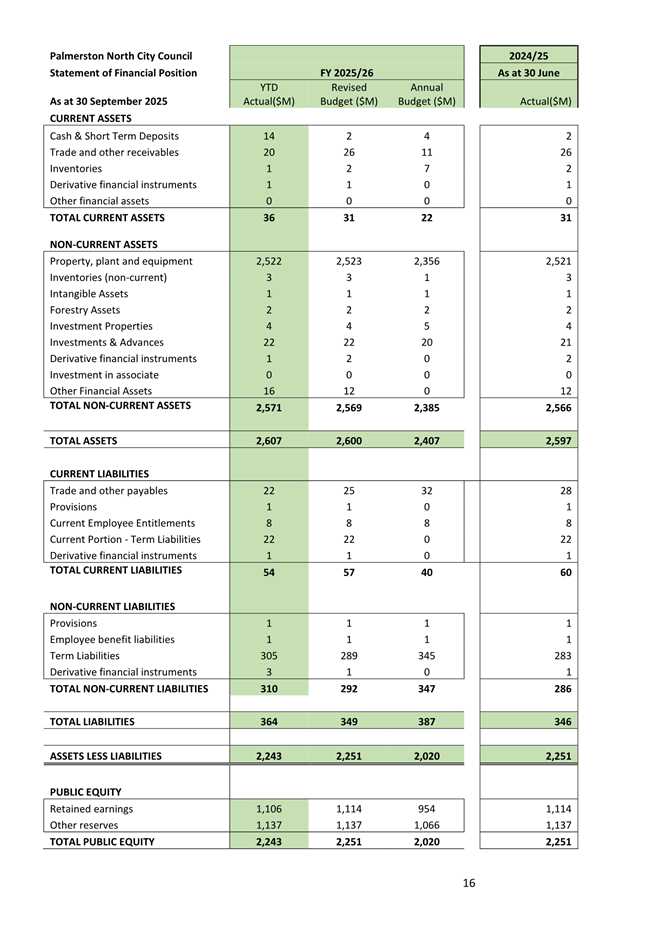
Details of operating, capital and non-financial performance are included in the attached report, with further information provided through the appendices to the report.
3. NEXT STEPS
The 6-month results are expected to be presented to the relevant Committee in February 2026.
4. Compliance and administration
|
Does the Council have delegated authority to decide? |
Yes |
|
|
Are the decisions significant? |
No |
|
|
If they are significant do they affect land or a body of water? |
No |
|
|
Can this decision only be made through a 10 Year Plan? |
No |
|
|
Does this decision require consultation through the Special Consultative procedure? |
No |
|
|
Is there funding in the current Annual Plan for these objectives? |
Yes |
|
|
Are the recommendations inconsistent with any of Council’s policies or plans? |
No |
|
|
The recommendations contribute to: Whāinga 1: He tāone auaha, he tāone
tiputipu Whāinga 2: He tāone whakaihiihi, tapatapahi ana Whāinga 3: He hapori tūhonohono, he hapori
haumaru Whāinga 4: He tāone toitū, he tāone
manawaroa |
||
|
The recommendations contribute to this plan: 14. Mahere mana urungi, kirirarautanga hihiri 14. Governance and Active Citizenship Plan The objective is: Oversee Council operations and communicate outcomes and decisions to our communities. |
||
|
Contribution to strategic direction and to social, economic, environmental and cultural well-being |
To enable Council to exercise governance by reviewing financial performance and operating performance and provide accountability for these to the public. |
|
|
1. |
Council Dashboard September 2025
⇩ |
|
|
2. |
Quarterly Performance and
Financial Report September 2025 ⇩ |
|
|
3. |
Quarterly Performance and
Financial Report September 2025 Appendix 1 ⇩ |
|
|
4. |
Quarterly Performance and
Financial Report September 2025 Appendices 2-11 ⇩ |
|
TO: Council
MEETING DATE: 12 November 2025
TITLE: Treasury Report - Quarter ending 30 September 2025
Presented By: Steve Paterson, Manager - Financial Strategy
APPROVED BY: Cameron McKay, General Manager Corporate Services
1. That Council note the performance of Council’s treasury activity for the quarter ending 30 September 2025.
1. ISSUE
1.1 To provide an update on the Council’s treasury activity for the quarter ending 30 September 2025.
2. BACKGROUND
2.1 The Council’s 2025/26 Annual Budget forecast additional debt of $48.2m would need to be raised during the 2025/26 year to fund the $63.1m of new and growth capital expenditure programmes (including assumed carry forwards from 2024/25). On 4 June 2025 Council authorised the Chief Executive to borrow up to an additional $49m for its purposes during 2025/26.
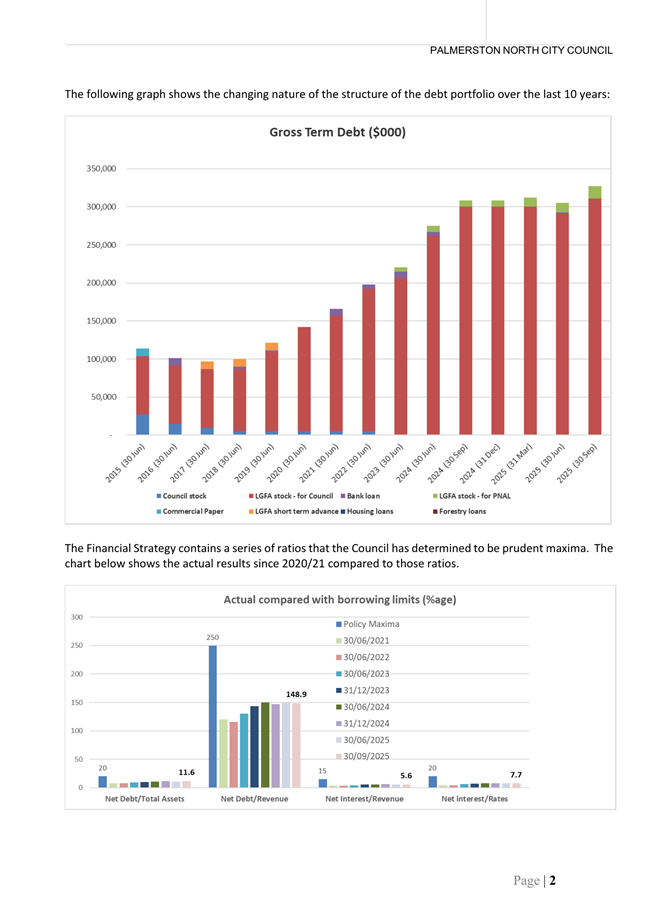
2.2 Council’s Financial Strategy (adopted 26 June 2024) contains the following ratios which the Council has determined to be prudent maxima:
· Net debt as a percentage of total assets not exceeding 20%
· Net debt as a percentage of total revenue not exceeding 250%
· Net interest as a percentage of total revenue not exceeding 15%
· Net interest as a percentage of annual rates income not exceeding 20%
2.3 The Treasury Policy (embracing the Liability Management and Investment Policy), an updated version of which was adopted by the Council on 14 February 2024, also contains a number of other criteria regarding debt management.
3. PERFORMANCE
3.1 The Council’s credit rating from S&P Global Rating (AA- stable) confirmed on 7 May 2025 remains unchanged.
3.2 Schedule 1 attached shows the details of Council’s debt as at 30 September 2025. Debt levels were within the policy parameters outlined in section 2 of this report.
3.3 The summarised term debt movements are shown in the following table:
|
|
Annual Budget 2025/26 $000 |
Actual – 3 months 2025/26 $000 |
Actual – 6 months 2025/26 $000 |
Actual – 9 months 2025/26 $000 |
Actual – 12 months 2025/26 $000 |
|
Debt balance at 1 July 2025: · Core Council debt · Debt on behalf of PNAL
Plus: new debt #2 Less: debt repayments #2 |
296.8 12.0
48.2 0 |
293.3 12.0
24.0 (1.9) |
|
|
|
|
Closing gross debt balance Comprising: Bank advance (on call) LGFA stock |
357.0
0 357.0 |
327.4
0 327.4 |
|
|
|
|
Less: Deposits held for debt repayment Sum advanced to PN Airport Ltd |
0
0 |
0
(16.0) |
|
|
|
|
Net Council related term debt Less: Cash & short-term deposits
|
$345.0 |
$311.4
(13.3) |
|
|
|
|
Net Council related debt |
$345.0 |
$298.1 |
|
|
|
#1 The Council’s LTP & AB do not currently include the debt related to PNAL.
#2 A portion of the Council’s debt is drawn on a daily basis – daily drawdowns and repayments are not included in these figures but the net draw or repayment for the year to date is shown as part of new debt or debt repayment as appropriate.
3.4 Gross debt at 30 September 2025 was $327.4m compared with $305.3m at 1 July 2025.
3.5 The debt raised in the three months to 30 September 2025 is explained further in the following table:
|
|
Position as at 1 July 2025 $m |
Position as at 30 September 2025 $m |
Change YTD $m |
|
Gross debt Less: portion relating to PNAL |
305.3 (12.0) |
327.4 (16.0) |
22.1 (4.0) |
|
Gross debt relating to Council Less: term deposit held to repay maturing debt |
293.3 0 |
311.4 0 |
18.1 0 |
|
Net Council related term debt Less: Cash & short-term deposits |
293.3
(0.9) |
311.4
(13.3) |
18.1
(12.4) |
|
Net Council related debt |
292.4 |
298.1 |
5.7 |
3.6 This shows net Council related net additional term debt of $18.1 m was raised during the three months. This compares with the authorised total sum for the year of $49m mentioned in clause 2.1.
3.7 In addition to deducting any liquid deposits from the gross debt when determining the net debt LGFA also deducts the value of the LGFA borrower notes that the Council is required to invest in each time it borrows from the LGFA. At the present time this investment is required to be 2.5% of the sum borrowed. For example, it means that if the Council borrows $10m it receives $9.5m in cash and $0.5m as an investment in notes. The notes have the same maturity date as the underlying borrowing and interest is paid to the Council on maturity at the borrowing rate less 0.2%.
3.8 The net debt after deducting the value of borrower notes is shown in the following table:
|
|
Position as at 1 July 2025 $m |
Position as at 30 September 2025 $m |
|
Net Council related debt (as above) |
292.4 |
298.1 |
|
Value of Council investment in LGFA borrower notes |
9.5 |
9.5 |
|
Net Council related term debt after deducting value of borrower notes |
282.9 |
288.6 |
3.9 A 10-year history of the gross & net debt is shown in the following graph:

3.10 Actual finance costs incurred by the Council depend on the actual debt levels and the interest rate. During the three months gross finance costs (including interest, line fees and the effects of payments relating to swaps) amounted to $3.1m compared with the budget for the year of $14.1m.
3.11 The net finance cost (after considering the interest income from the advance to Palmerston North Airport Ltd) is $2.85m compared with the budget for the year of $13.76m.
3.12 The effective weighted average interest rate for the year is 3.9% compared with the budgetary assumption of 4.4%.
3.13 The Council has entered financial instruments related to its debt portfolio utilising swap trading lines established with Westpac, ANZ and BNZ. The details of these are shown in Schedule 2 attached.
The value of these instruments is measured in terms of its ‘mark-to-market’, i.e. the difference between the value at which the interest rate was fixed and the current market value of the transaction. Each of these transactions was valued at the date they were fixed and again at the reporting date. Financial reporting standards require the movement in values to be recorded through the Council’s Statement of Comprehensive Income (Profit & Loss Account). They have been revalued as at 30 September 2025. The latest valuation is a liability of $3.55m compared with an asset of $1.02m as at 30 June 2025. The reduction in asset value of $4.57m is a consequence of reducing market interest rates.
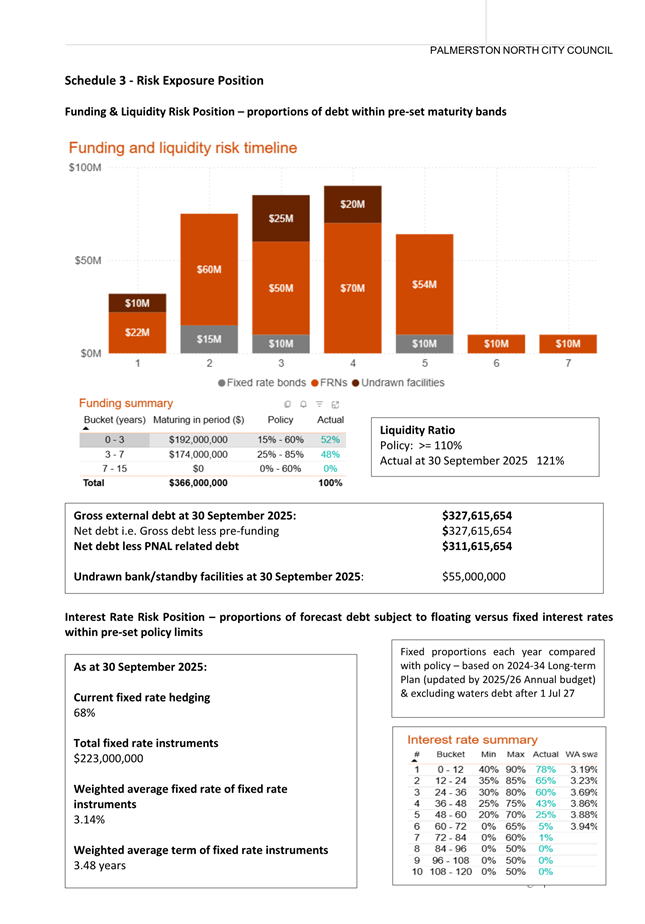
3.14 The Council’s Treasury Policy contains guidelines regarding the measurement of treasury risk as follows:
· Funding and liquidity risk is managed by the Council maintaining a pre-set portion of its debt in a range of maturity periods, e.g. < 3 years, 3 - 7 years, 7 years +.
· Interest rate risk is managed by the Council maintaining the ratio of debt that is subject to floating versus fixed interest rates within pre-set limits.
3.15 The position compared to the policy is illustrated in the graphs in Schedule 3 attached.
3.16 The funding and liquidity risk position can be summarised as follows:
· Council’s liquid position complies with policy.
· Since 1 July 2025 $24m of term debt has been raised and $1.9m of bank debt has been repaid.
3.17 The interest rate risk position describes the portion of the overall forecast debt that is fixed versus floating and can be summarised as follows:
· There is uncertainty about forecast levels of future debt – this very much depends on a number of factors including future Council decisions on the proposed capital expenditure programme, the debt transfer arrangements for the new three waters entity, and the extent of external funding able to be organised from other arrangements.
· Policy compliance at 30 September 2025 is based on the debt forecasts in the adopted Long-term Plan updated by the 2025/26 Annual Budget.
3.18 The Treasury Policy also contains requirements in relation to counterparty credit risk – this relates to investments and financial risk management instruments.
The position as at 30 September 2025 is shown in Schedule 4 attached.
3.19 Council’s credit lines with the banks include a $20m three-year credit facility with Westpac Bank (maturing 31 October 2028) and a revolving $25m three-year facility with ANZ Bank (maturing 31 March 2028). In March 2025 a new revolving 15 month $10m standby line was arranged with LGFA.
4. CONCLUSION AND NEXT STEPS
4.1 Gross finance costs for the three months to 30 September (including interest, line fees and the effect of swaps) was $3.1m compared with budget for the year of $14.1m. The net finance cost (after considering the interest income from term investments and the advance to Palmerston North Airport Ltd) is $2.85m compared with the budget for the year of $13.76m.
4.2 In conjunction with Council’s treasury advisors hedging instruments are regularly reviewed in an effort to ensure the instruments are being utilised to best advantage as market conditions change. The level of hedging cover is also reviewed as the forecasts of future debt levels are revised.
4.3 Council’s borrowing strategy is continually reviewed, in conjunction with Council’s treasury advisors, to ensure best advantage is taken of Council’s quality credit rating.
4.4 A further performance report will be provided after the December 2025 quarter.
5. Compliance and administration
|
Does the Council have delegated authority to decide? |
Yes |
|
|
Are the decisions significant? |
No |
|
|
If they are significant do they affect land or a body of water? |
No |
|
|
Can this decision only be made through a 10 Year Plan? |
No |
|
|
Does this decision require consultation through the Special Consultative procedure? |
No |
|
|
Is there funding in the current Annual Plan for these objectives? |
Yes |
|
|
Are the recommendations inconsistent with any of Council’s policies or plans? |
No |
|
|
The recommendations contribute to: Not Applicable |
||
|
The recommendations contribute to this plan: 14. Mahere mana urungi, kirirarautanga hihiri 14. Governance and Active Citizenship Plan The objective is: To enable the Council to exercise governance by reviewing and monitoring Council’s treasury performance. |
||
|
Contribution to strategic direction and to social, economic, environmental and cultural well-being |
Managing the Council’s treasury activity is a fundamental component of day to day administration of the Council. |
|
|
1. |
Schedules 1 to 4 ⇩ |
|
TO: Council
MEETING DATE: 12 November 2025
TITLE: Central Economic Development Agency (CEDA) Annual Report 2024/25
PRESENTED BY: David Murphy, General Manager Strategic Planning
APPROVED BY: Waid Crockett, Chief Executive
1. That Council receive the Central Economic Development Agency (CEDA) Annual Report 2024/25 (Attachment 1).
1. ISSUE
1.1 Central Economic Development Agency (CEDA) has submitted its Annual Report 2024-25 (Attachment 1). This memorandum provides an opportunity for Elected Members to review the progress CEDA has made against its Statement of Intent during the period 1 July 2024 to 30 June 2025.
1.2 Representatives of CEDA will be in attendance to present the Annual Report and answer questions.
2. BACKGROUND
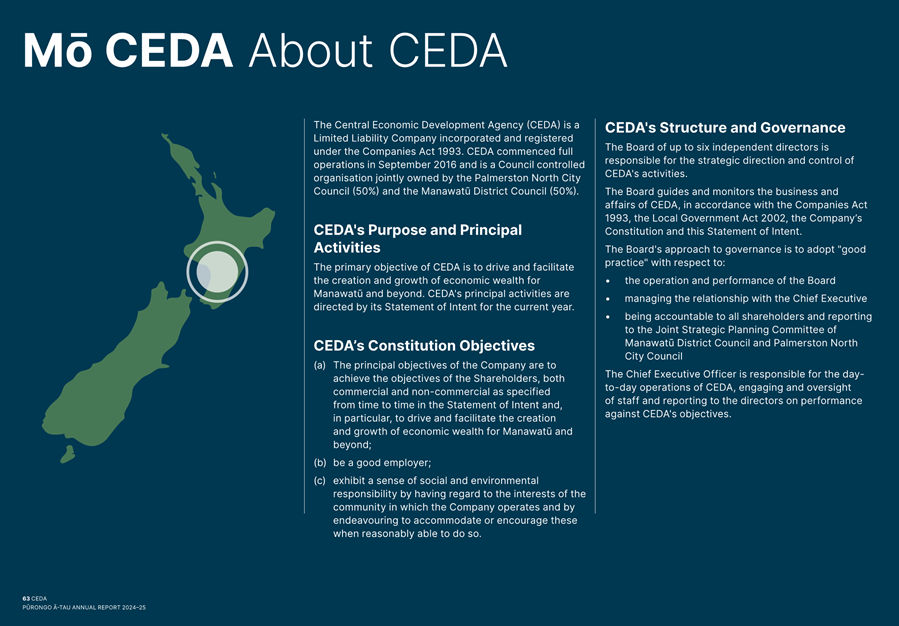
2.1 CEDA is a Council Controlled Organisation (CCO) under the Local Government Act 2002 (LGA) and is jointly owned by Manawatū District Council (MDC) and Palmerston North City Council (PNCC).
2.2 For the 2024-25 year, MDC and PNCC as joint shareholders expected CEDA to focus on the delivery of the following core functions and outcomes, as detailed in the Statement of Expectation (SOE) 2024-25 to 2026-27:
· Stimulate inward investment (both national and international), retention and expansion of business in the Manawatū region;
· Develop a talent pipeline; and
· Support domestic visitation and tourism.
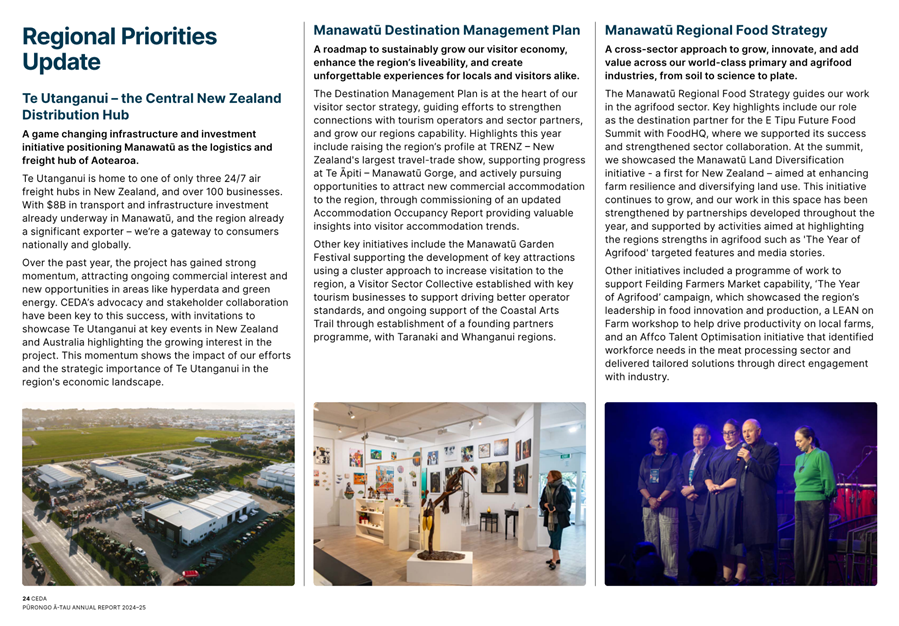
2.3 Further to the required core functions and outcomes, the SOE details the shareholder’s top priorities as:
· Te Utanganui, Central New Zealand Distribution Hub;
· Strategic oversight and coordination of the Manawatū Food Strategy;
· Promotion and development of key tourism and visitor destinations; and
· Inward investment in the Feilding town centre and Palmerston North city centre.
2.4 The full SOE 2024-25 is included as Attachment 2.
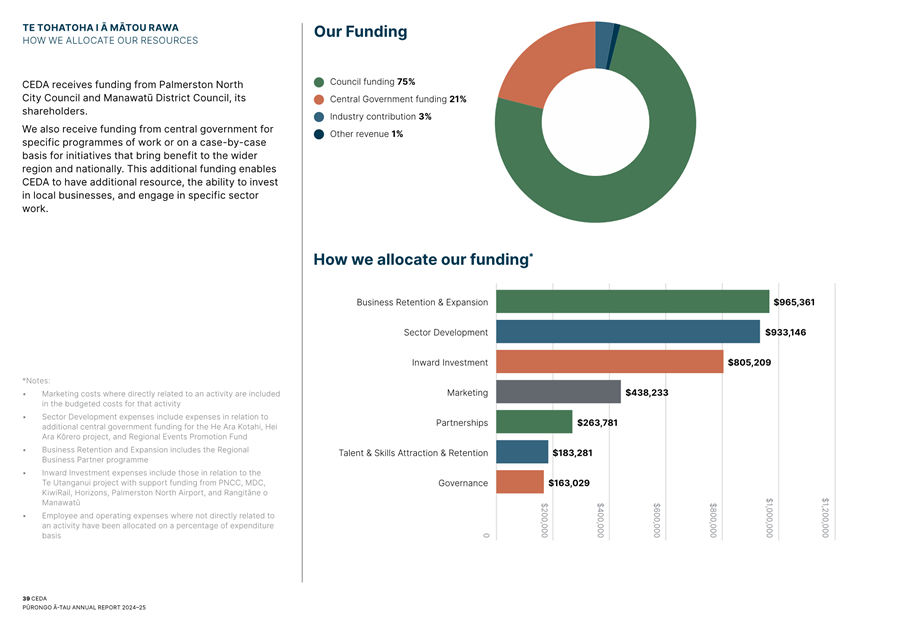
2.5 In 2024-25, MDC granted $691,534 and PNCC granted $2,052,000 to CEDA to deliver on the SOE.
2.6 The Local Government Act (LGA) requires CCOs to produce an annual report which compares its actual and intended performance (as set out in the Statement of Intent) and audited financial statements.
3. PERFORMANCE FOR THE YEAR JULY 2024 - JUNE 2025
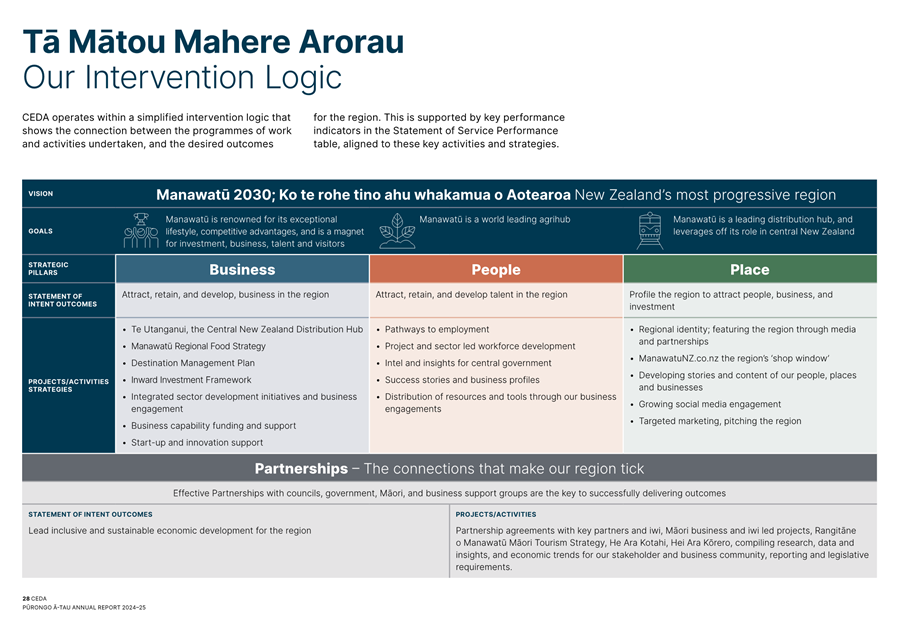
3.1 CEDA’s response to the SOE is based around their four strategic objectives:
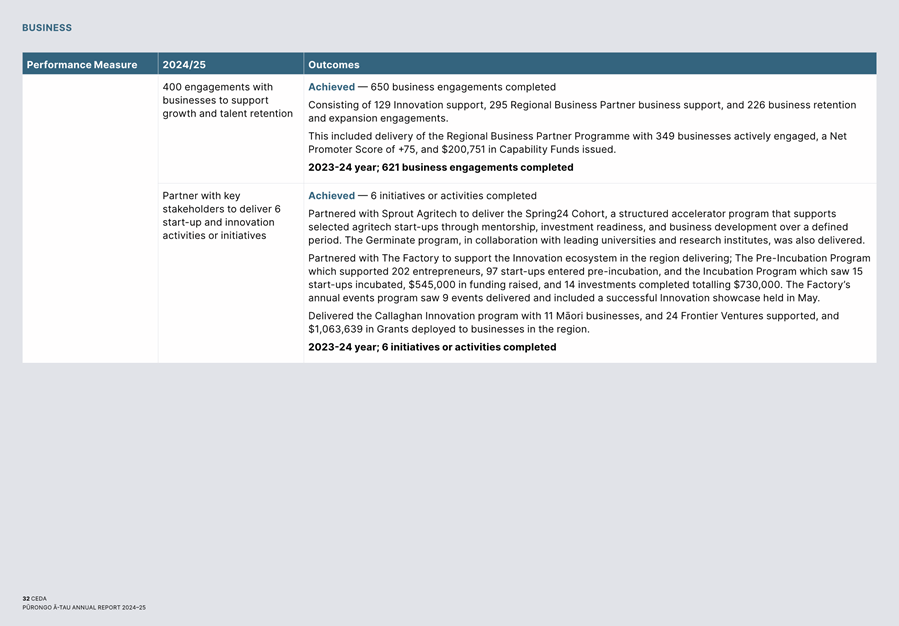
· Business: Attract, retain and develop business and investment in the region;
· People: Attract, retain and develop talent in the region;
· Place: Profile the region to attract people, business and investment; and
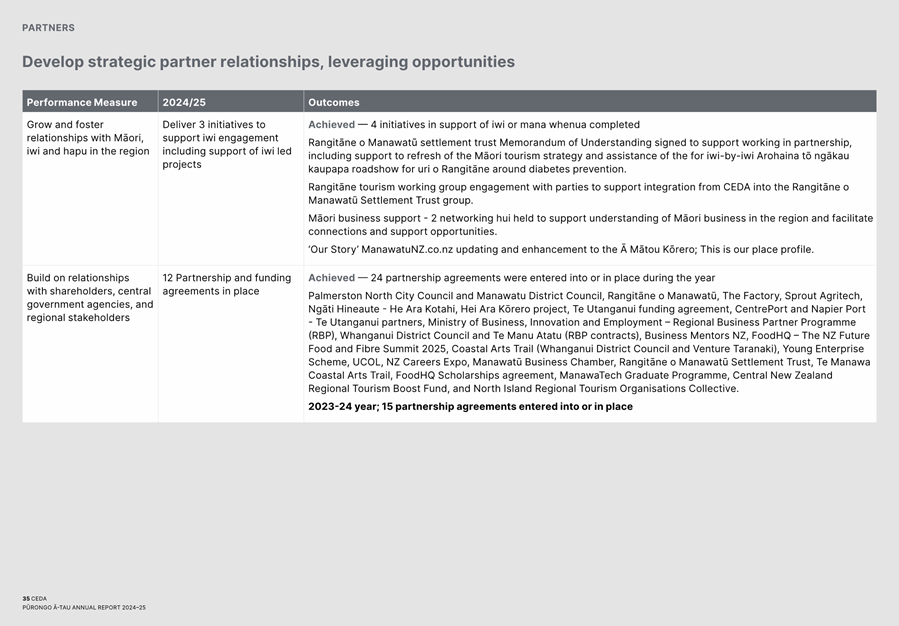
· Partners: Lead inclusive and sustainable economic development for the region.
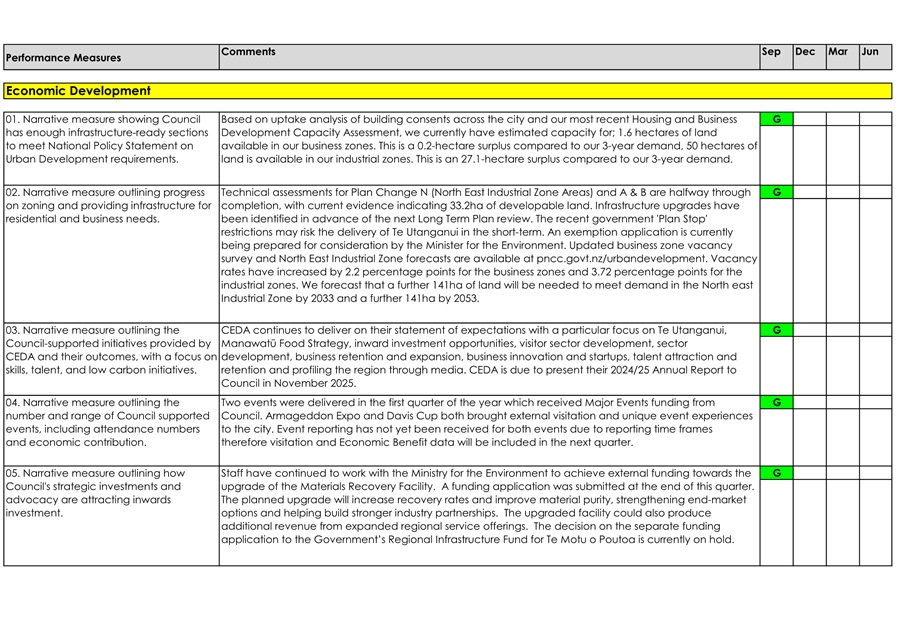
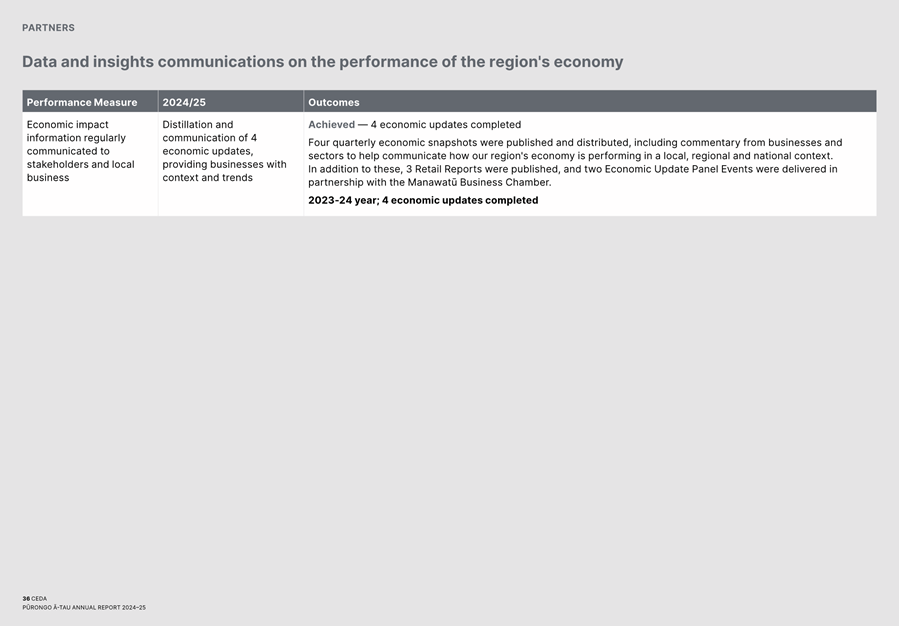
3.2 The Chairperson report and Chief Executive report within the Annual Report include the following highlights:
· A resilient regional economy: Despite national slowdowns and inflationary pressure challenging and impacting many sectors, the Manawatū economy showed resilience outperforming many other regions due to the diverse economy and long-term investments.
· A strategic focus: CEDA maintained momentum toward their Manawatū 2030 vision – New Zealand’s most progressive region, working towards building a sustainable, future-focused regional economy centred on agrifood, logistics, and innovation. Progressing key economic initiatives through priority projects such as Te Utanganui – the Central New Zealand Distribution Hub and the Manawatū Food Strategy.
· Showcasing the Manawatū: positioning Manawatū as a vibrant, connected and future-focused region.
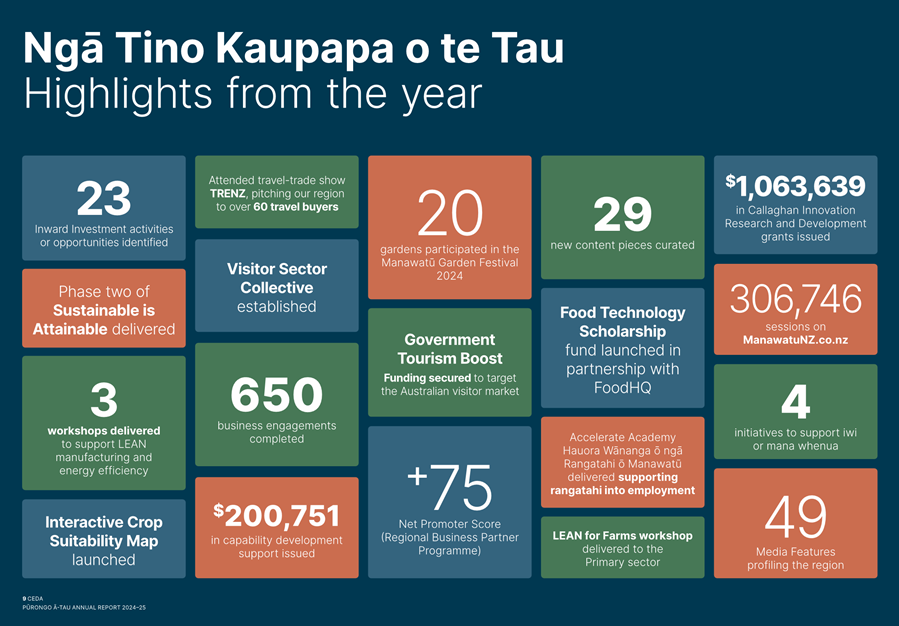
3.3 Based on the Annual Report, the key highlights for the year are:
Business:
· Te Utanganui – Central New Zealand Distribution Hub advocacy gaining national visibility and momentum.
· 23 inward investment activities and opportunities identified, exceeding the performance measure target.
· Manawatū Regional Food Strategy – interactive crop suitability map launched, Food Technology Scholarship fund launched in partnership with Food HQ, and LEAN for farms workshop delivered.
· Destination Management Plan progressed - attended travel-trade show TRENZ pitching the region to over 60 travel buyers, and the visitor sector collective established.
· 650 business engagements completed spanning innovation support, regional business partner support, visitor and tourism, primary industries, technology, and distribution and logistics.
· Manawatū Garden Festival bloomed to 20 gardens participating in 2024.
· Over $1million in Callaghan Innovation research and development grants issued.
· Regional Business Partner Programme net promoter score +75 reflected a very high level of satisfaction among the businesses assisted.
· Over $200,000 in capability development support issued.
People:
· Talent work focused on connecting employers with skilled people.
· Strengthening pathways for rangatahi (youth) and graduates, delivered in partnership with industry aligned to workforce needs.
· Supporting rangatahi into employment through the Accelerate Academy (Health) Hauora Wānanga o ngā Rangatahi o Manawatū.
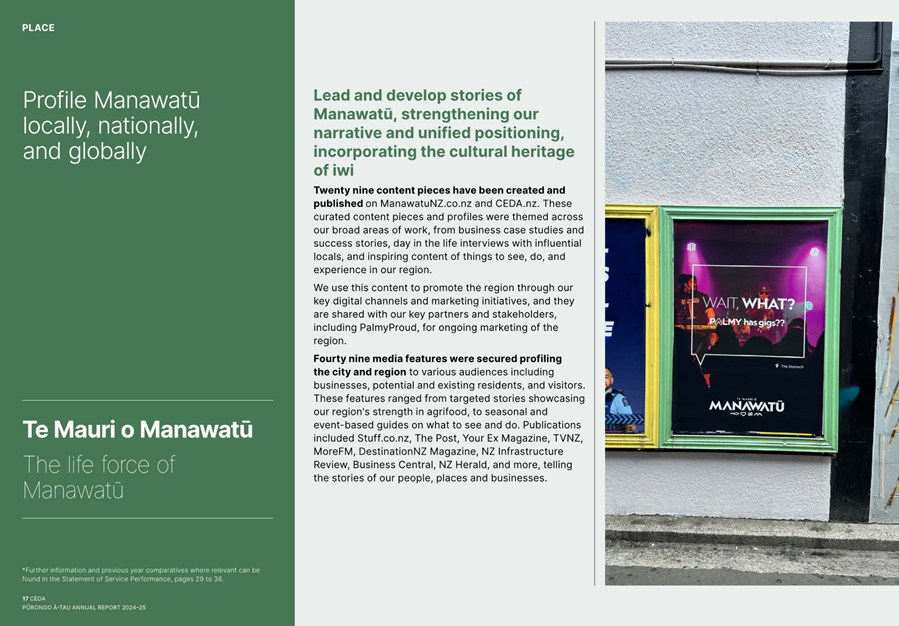
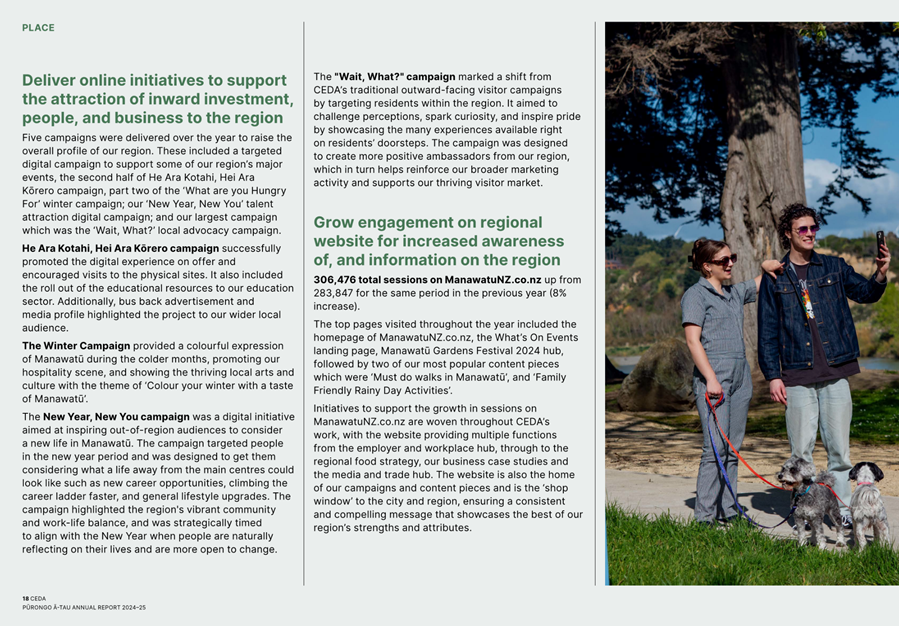
Place:
· 29 new content pieces created and published on ManawatuNZ.co.nz with over 300,000 sessions (website visits).
· Five campaigns were delivered over the year to raise the overall profile of the region along with 49 media features.
Partnerships:
· Four initiatives in support of iwi or mana whenua completed.
· 24 partnership agreements were entered into or in place during the year.
· A narrative summary of CEDA’s work on each of the strategic objectives is detailed on pages 11-13 (Business), 14-15 (People), 16-20 (Place) and 21-23 (Partners) of the Annual Report.
· A more specific assessment of CEDA’s service performance against the SOI targets for each of the strategic objectives is detailed on pages 29 – 36 of the Annual Report.
· The regions performance against a series of quantitative monitoring indicators is detailed on page 37 of the Annual Report. While several are awaiting up to-date data, the results reflect the challenging economic environment identified in the introductory reports from the CEDA Chairperson and Chief Executive.
4. financial performance for the year july 2024 – June 2025
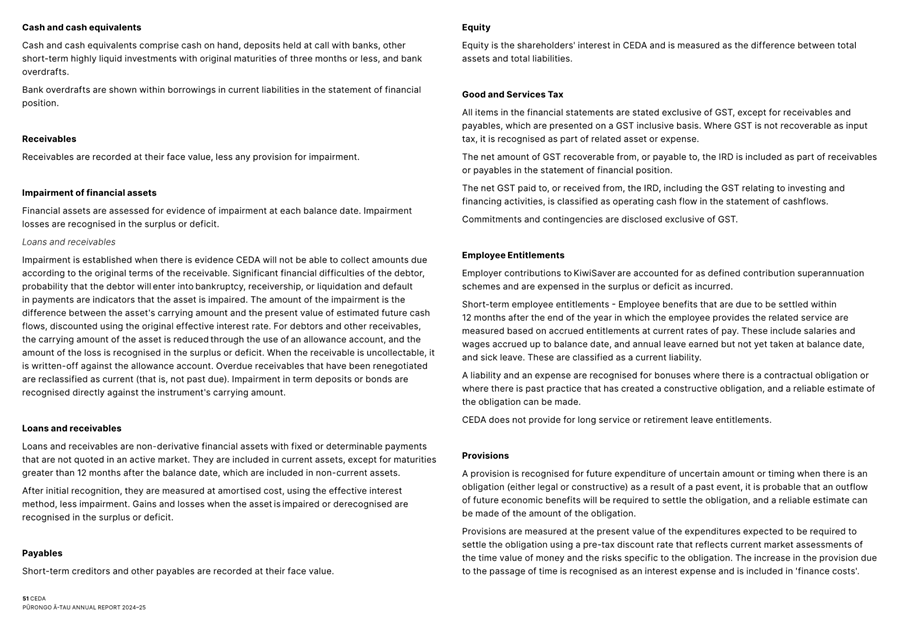
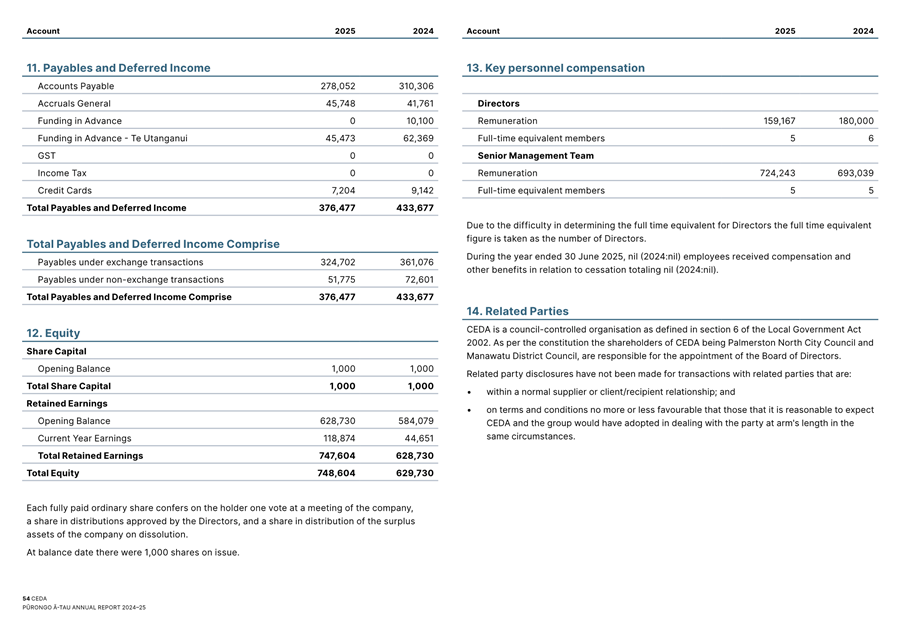
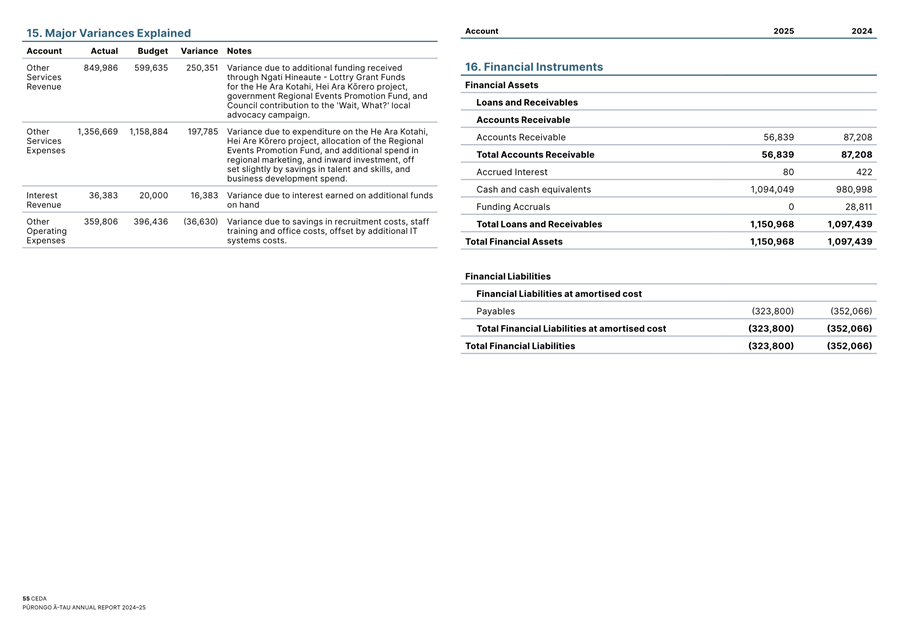
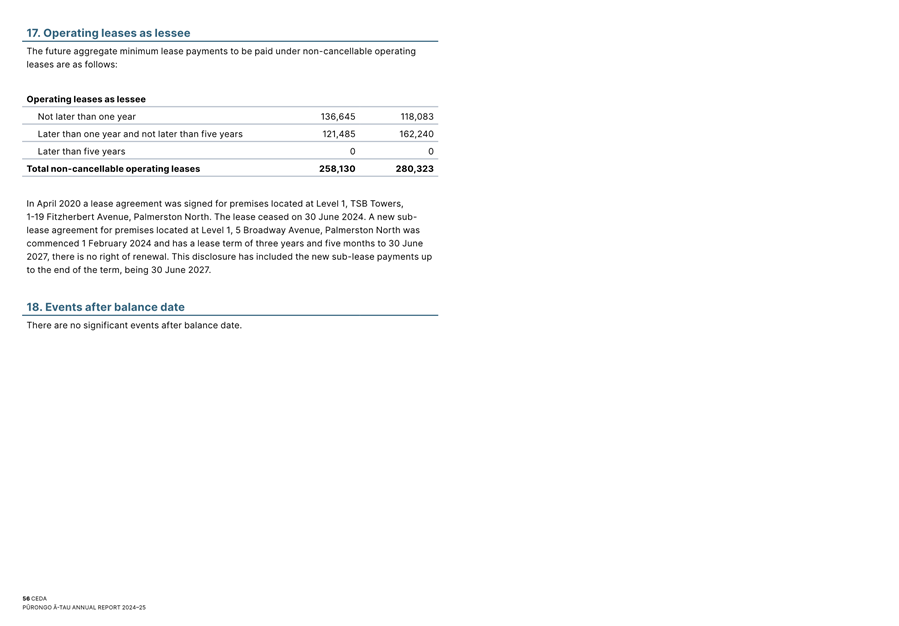
4.1 CEDA’s financial performance is detailed at pages 43-60 of the Annual Report.
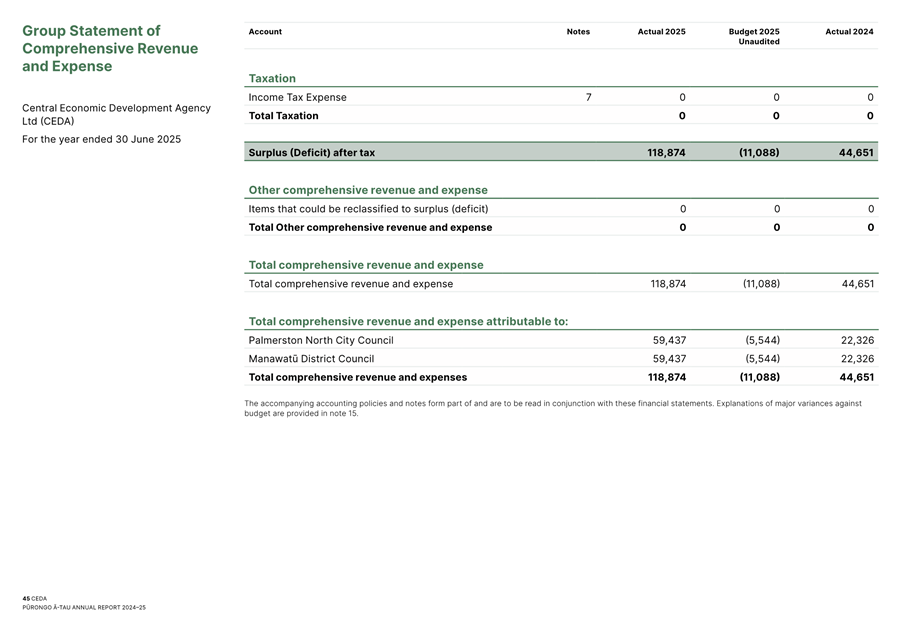
4.2 CEDA achieved a modest operating surplus, indicating sound financial management and efficient use of shareholder funds for the 2024-25 year with a $118,874 surplus against a budgeted $11,088 deficit.
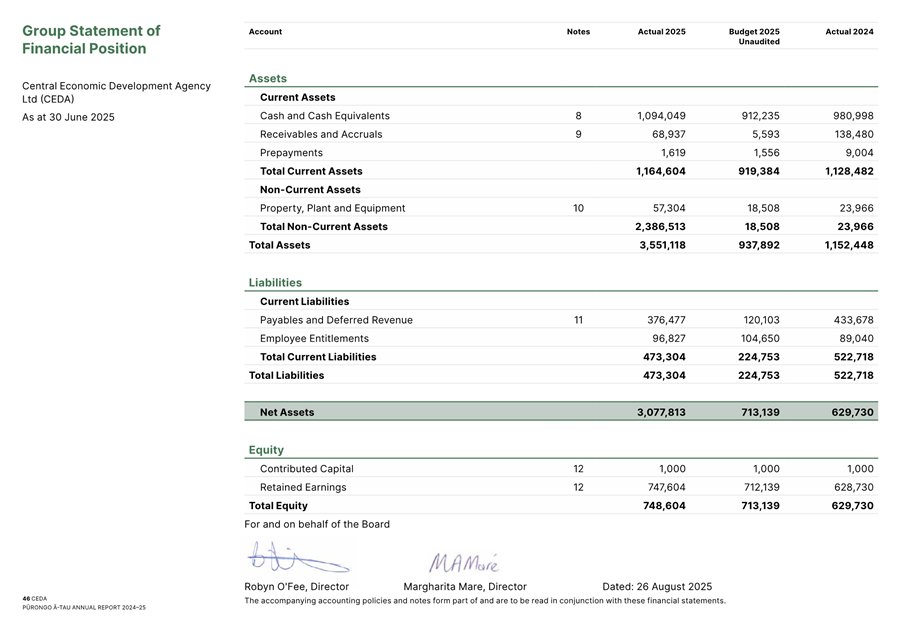
4.3 CEDA finished the 2023-24 year with total equity of $748,604 against a budget of $713,139.
4.4 The 2024-25 Annual Report includes an independent auditor’s report at pages 61-62.
5. NEXT STEPS
5.1 CEDA to prepare a Statement of Intent for 2026/27.
6. Compliance and administration
|
Does Council have delegated authority to decide? |
Yes |
|
|
Are the decisions significant? |
No |
|
|
If they are significant do they affect land or a body of water? |
No |
|
|
Can this decision only be made through a 10 Year Plan? |
No |
|
|
Does this decision require consultation through the Special Consultative procedure? |
No |
|
|
Is there funding in the current Annual Plan for these objectives? |
Yes |
|
|
Are the recommendations inconsistent with any of Council’s policies or plans? |
No |
|
|
The recommendations contribute to: Whāinga 1: He tāone auaha, he tāone
tiputipu |
||
|
The recommendations contribute to this plan: 2. Mahere whakawhanake ohaoha 2. Economic Development Plan The objective is: We want an innovative, resilient and low carbon city economy, where communities prosper and achieve their goals. |
||
|
Contribution to strategic direction and to social, economic, environmental and cultural well-being |
Our city’s economic wellbeing depends on opportunities to improve our standard of living and reduce economic disadvantage. A profitable business sector, knowledge and skills, work, health, environmental amenity, and housing, all contribute to living standards. We will partner with agencies and organisations to improve wellbeing. We will focus on delivering the conditions needed to support economic activity in the city, now and into the future. |
|
|
1. |
CEDA Annual Report 2024/25 ⇩ |
|
|
2. |
CEDA Statement of Expectations
2024-27 ⇩ |
|
TO: Council
MEETING DATE: 12 November 2025
TITLE: Palmerston North Quarterly Economic Update - October 2025
Presented By: Stacey Andrews, City Economist
APPROVED BY: David Murphy, General Manager Strategic Planning
1. That Council receive the Palmerston North Quarterly Economic Update – October 2025, including:
a. Palmerston North Economic Growth Indicators – October 2025 (Attachment 1), and
b. Palmerston North Quarterly Economic Card Spending Report – September 2025 (Attachment 2).
1. purpose
1.1 This memorandum presents a summary of the key themes in the Palmerston North Quarterly Economic Update to November 2025, and the Palmerston North Quarterly electronic card spending report for the June quarter 2025.
1.2 The quarterly economic update is prepared in-house, using data from a range of sources to provide the most up-to-date information available on the city economy. This includes national and global data where appropriate, to inform decision makers of broader conditions that are impacting on local economic conditions.
1.3 The quarterly economic update is organised under the categories of ‘Gross Domestic Product (GDP) and national indicators’, ‘business and jobs’, ‘earnings and income’, ‘spending’, and ‘housing’. National data that influences the city economy, such as the Consumer Price Index (CPI) and the Official Cash Rate (OCR), are also included in the quarterly economic update. This update is attached as Attachment 1.
1.4 The Palmerston North Quarterly electronic card spending report is prepared in-house and provided as a resource to the city retail sector. This report includes information on retail spending across the city and by precinct. The electronic card spending report for the city is included as Attachment 2.
1.5 Section 2 of this report includes a high-level summary of economic outcomes for the city based on the most recent economic data. A more in-depth analysis of economic performance, including the economic outlook for the city, is included within sections 3 to 5 of this report.
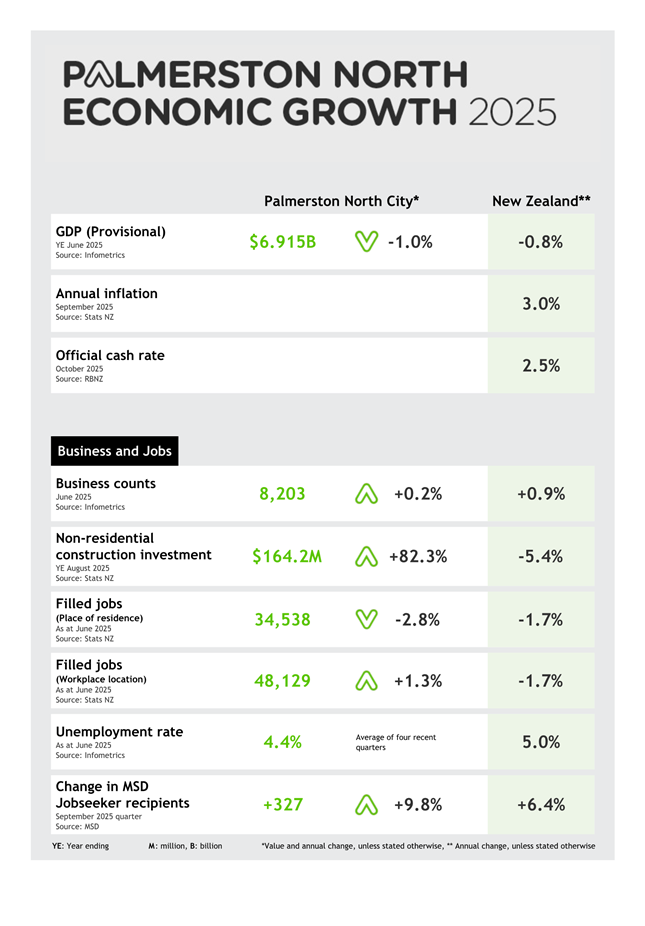
2.1 Infometrics reports that the Palmerston North economy contracted by 1.0% in the year to June 2025, compared with a 0.8% decline nationally. Statistics NZ has since released GDP figures for the June quarter indicating a greater contraction in economic activity nationally than reflected in the Infometrics estimates (-1.1%). Statistics NZ do not publish GDP data at the territorial authority level.
2.2 In response to ongoing weakness in the New Zealand economy, the Reserve Bank of New Zealand (RBNZ) cut the OCR by a further 50 basis points to 2.5% in October, with a further 25 basis point cut expected in November. This comes alongside inflation inching up to the top of the RBNZ target range (3.0%) over the year to September 2025. The drivers of this increase in inflation are transitory and driven by factors insensitive to domestic interest rates such as rising electricity costs and the annual lift from rates. Ongoing spare capacity across the New Zealand economy has convinced the RBNZ that lower borrowing costs are necessary to support economic recovery, with lower debt servicing costs expected to ease pressures on households and businesses and support stronger demand across the economy.
2.3 Migration is a key driver of New Zealand’s labour supply, both through retaining local skills and attracting workers from overseas. Recent data shows a net gain of just 10,600 people into New Zealand in the year to August 2025. This is well below long term trends and reflected both a higher outflow of New Zealanders overseas and fewer new arrivals. These shifts underscore the importance of economic opportunities in retaining and attracting the skills and labour needed to support the economic recovery of the New Zealand economy.
2.4 New Zealand’s rural sector is a key source of resilience in a difficult economic environment. Exports rose by 13.5% in the year to September 2025, led by a 23.3% increase in the value of ‘milk powder, butter and cheese’ exports. Dairy is also Palmerston North’s largest goods export making up 54% of total goods exports from the city. Dairy payout to our producers was estimated at $67 million in 2024/2025 rising to $438 million when we include the Manawatū District. Ongoing strength in the sector is expected to yield a similar payout to our farmers in the 2025/2026 season. Ongoing strength in the sector is supporting economic activity and helping to stabilise the wider regional economy.
2.5 Labour market conditions continue to reflect current challenges to the broader economy, with unemployment and jobseeker numbers increasing over the past year. At the same time, there are signs of resilience and improvement. The number of jobs located in the city grew by 1.3% in the year to June 2025 (+641), in contrast to a national decline. Non-residential construction investment has been a major driver of activity, with consent values in the city rising 82.3% in the year to August 2025, compared with a 5.4% decline nationally. This growth has been driven by private investment in industrial, accommodation, and commercial buildings. The combination of lower borrowing costs, ongoing public and private investment, and improved employment intentions point to a more positive outlook for 2026.
2.6 Earnings growth has slowed as labour market conditions weaken and wage pressures ease. Total annual earnings in the city increased by just 0.8% in the year to June 2025, compared with a 1.5 % increase nationally. Wage growth has also moderated, with the Labour Cost Index falling to 2.3%, down from the stronger increases recorded between 2022 and 2024 when labour shortages drove up costs. These shifts are consistent with the broader labour market trends, with spare labour market capacity reducing wage pressures and earnings growth expected to return to long-term averages.
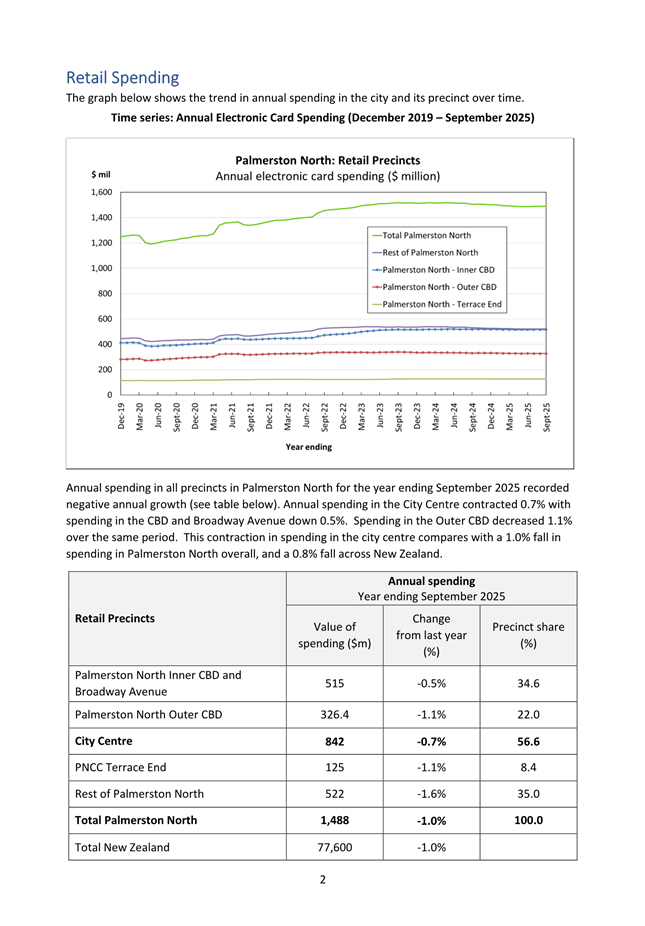
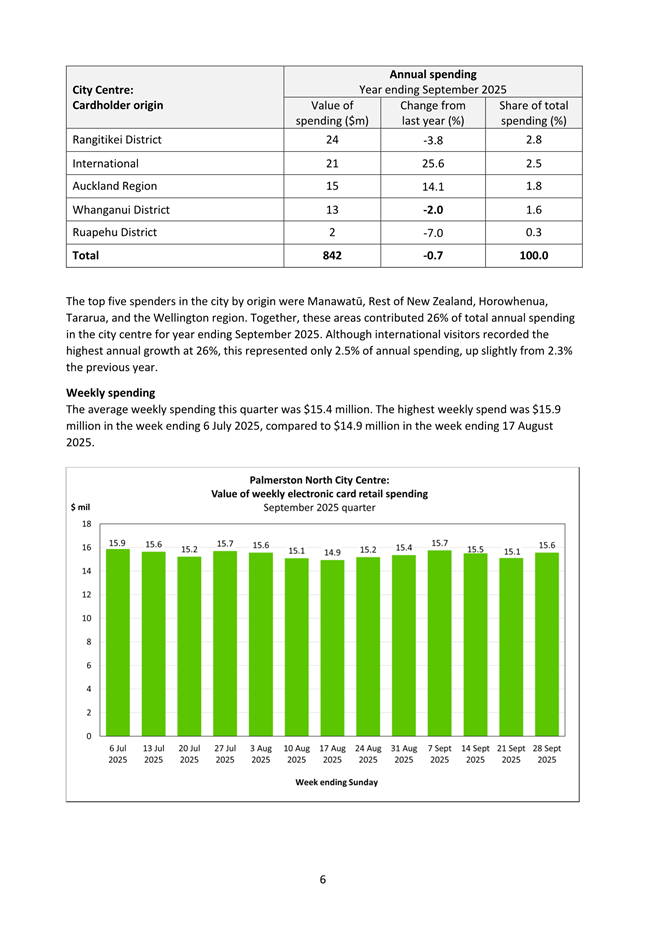
2.7 Electronic card spending fell 1.0% in the city over the year to September, with the city centre proving more resilient than the city as a whole. Lower fuel prices eased pressure on households while spending on grocery items increased driven by rising prices. National monthly data for July and August showed tentative improvement in discretionary categories as rate cuts begin to pass through to households. In the city, customer loyalty edged up (82% retained locally) over the year to June, with the city recording a $293m net gain in spending due to the visitor spend exceeding the spend of residents outside the city.
2.8 Palmerston North’s housing market is stable, with house prices rising 0.4%, sales volumes increasing, and rental property numbers growing. Affordability remains stronger than nationally, while public and transitional housing registrations have decreased year-on-year but increased both here and nationally compared with the June quarter. New dwelling consents in the city for the August year sat at 426, however net dwelling consents (amended for relocatables and uplifts) are tracking slightly below expectation at 267. Projections for 2024-2027 cite annual average new dwellings of 273 per year[2].
3 Quarterly economic Update
3.1 GDP and National Indicators
Weak economic activity over the New Zealand winter was enough to convince the RBNZ that lower interest rates are required to support the recovery of the New Zealand economy.
a) Infometrics reports that Palmerston North GDP fell by 1.0% over the year to June 2025 to a total value of $6.915 billion. This compares with a 0.8% decrease in GDP nationally. Infometrics estimates for the June quarter were published on 21 August 2025.
b) In contrast to Infometrics figures, Statistics NZ estimates (published 18 September) indicates national GDP fell by 1.1% over the year to June 2025, significantly more than that estimated by Infometrics. This deeper than expected contraction was driven by a weak June quarter where GDP fell 0.9%. June quarter weakness was led by manufacturing which contracted 3.5% since March. Weakness was also wider spread with ten of sixteen industries estimated to have contracted in the June quarter.
c) In response to ongoing weakness in the New Zealand economy, the RBNZ cut the OCR by a further 50 basis points to 2.5% in October, with a further 25 basis point cut expected in November. Ongoing spare capacity across the New Zealand economy has convinced the RBNZ that lower borrowing costs are necessary to support economic recovery, with lower debt servicing costs expected to ease pressures on households and businesses and support stronger demand across the economy.
d) Annual inflation (as measured by the Consumer Price Index - CPI) increased from 2.7% in the June quarter 2025, to 3.0% in the September quarter 2025. This increase was consistent with RBNZ and market expectations and will not deter the bank from further easing of the OCR.
e) The increase in annual inflation was not driven by an excess in demand relative to supply (demand-pull inflation) and is therefore insensitive to holding interest rates higher. Increasing prices for electricity (+11.3%), actual rentals for housing (+2.6%) and the annual lift from local authority rates (+8.8%) made up 28.4% of the 3.0% lift in prices over the year[3]. Higher costs were partly offset by lower prices for pharmaceuticals (-10.6%) and telecommunications equipment (-15.2%) with ongoing softness in petrol prices continuing to provide relief to household budgets. Following this temporary lift in inflation in the September quarter, the RBNZ now expects annual inflation to move back to 2.7% in the December quarter, before falling away to 2.2% by June 2026.
f) While the RBNZ’s primary mandate is to maintain price stability, it also considers wider population and employment dynamics when setting monetary policy. Net international migration has weakened due to the slowdown of the New Zealand economy and it follows, the reduction in jobs available to either encourage people to stay, or new migrants to come to New Zealand. The latest international migration data for August 2025, indicates that 127,900 people left New Zealand over the year to August 2025 compared with 138,600 people coming into the country. This is a net increase in annual net migration of just 10,600. Figure 1 indicates the ten-year trend in annual net international migration by broad age group.
g) New Zealand’s labour market still has spare capacity to support recovery, but businesses report growing difficulty finding people with the right skills. In the year to August 2025, 56,387 New Zealanders aged 30–64 left the country, well above the long-term average of 35,500. While younger people commonly go overseas for work, the unusually high outflow of older, more experienced workers is heightening concerns about skills shortages and the risk of lost productive capacity. Business and community leaders have flagged this risk over the past two years, and recent confidence surveys indicate rising recruitment challenges. Figure 2 shows the ten-year trend in departures by age group.
Figure 1: New Zealand annual net migration by age group (August years)
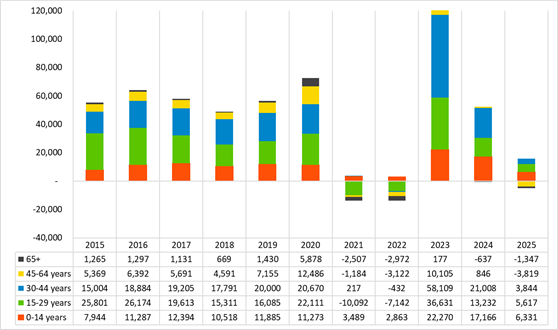
Figure 2: New Zealand departures by age group (August years)

h) At the local level, Statistics NZ estimates of net international migration are available with a 12–16 month lag. The most recent figures for Palmerston North, covering the year to March 2024, show that 297 more residents left the city than arrived. This was a common trend across much of New Zealand during that year. These estimates are subject to revision and they need to be considered alongside other factors that influence population patterns. Palmerston North continues to experience natural increase due to a younger population, while internal migration also plays a role as people move between regions for lifestyle, housing, and education opportunities. The Statistics NZ Estimated Resident Population (ERP) figures due for release at the end of October, will provide greater clarity on how current population trends are affecting Palmerston North.
i) New Zealand’s export strength continues to boost regional economic resilience. The value of New Zealand goods exports increased 13.5% over the year to September 2025 with the value of the city’s largest export ‘milk powder, butter and cheese’ up 23.3% ($23.6 billion). Dairy exports from the city make up 54% of the city’s total goods exports. Infometrics estimates a total payout of $67 million to our dairy farmers over the 2024/2025 with the 2025/2026 season expected to yield similar results. Including Manawatū District, the dairy payout increases to an estimated $438 million for both the 2024/2025 and the 2025/2026 season. Located amid a highly productive rural economy, Palmerston North’s role as a large urban centre enables it to both support and benefit from the strength of the broader rural economy.
3.2 Business and jobs
Unemployment and jobseeker numbers reflect current economic pressures, but strong non-residential construction and increasing job numbers in the city, point to an improving outlook.
a) A total of 8,203 businesses were located in Palmerston North in June 2025; an increase of 19 businesses from the previous year (+0.2%). This compares with a 0.9% increase in the number of businesses registered nationally, over the same timeframe.
b) There was a total of $164.2 million worth of non-residential consents issued in Palmerston North over the year to August 2025. This is an annual increase of 82.3%, compared with a 5.4% decrease in the value of non-residential consents nationally.
c) This growth in non-residential construction is dominated by a sharp increase in private sector investment. The increase in private sector construction investment in the city is being led by a 139.2% increase in investment in ‘factories, industrial and storage buildings’ to a total of $53.9 million and an 86.0% increase in commercial construction to $52.5 million over the year. The latter was supported by the $30 million consent issued for the new airport terminal building in late August. Investment in ‘hotels, motels and short-term accommodation’ was also elevated, rising more than three-fold to a total value of $3.7 million over the year to July 2025. Non-residential construction in the city and wider region continues to be well supported with a further $10 million consent issued for the construction of the Wyndham Tryp Hotel in September and estimated defence force investment across the region of more than $1.3 billion to 2033.
d) In the year to June 2025, the number of employed Palmerston North residents declined by 989 people (-2.8%) to 34,538. In contrast, jobs located in the city increased by 641 (+1.3%) compared with June 2024, bringing the total number of jobs in the city to 48,129. The jobs growth in the city runs counter to the national trend, where jobs fell by 1.7% over the same period. This data does not include self-employment.
e) The annual average unemployment rate in Palmerston North increased from 4.3% in the March quarter to 4.4% in the June quarter 2025. This compares with a 5.0% annual average unemployment rate, nationally. The national unemployment rate published by Statistics NZ was 5.2% in the June quarter 2025. This statistic does not average the unemployment rate over four-quarters. The RBNZ expects the New Zealand unemployment rate to peak at 5.3% in the September quarter 2025, easing to 5.1% in the June quarter 2026.
f) In the year to September, 3,648 people in Palmerston North were receiving Jobseeker Support, up 327 from the previous year. This represents a 9.8% increase, compared with 10.0% nationally. Of these, 1,710 were supported due to health conditions or disabilities, +12.4% over the year compared with +15.4% nationally. Growth was observed across all age groups, with the number of jobseekers aged 18–24 rising 141 (16.9%), compared with +14.4% nationally. The second largest increase was in jobseekers aged 25-39 years, up 117 (10.6%) in the city over the year compared with a 9.3% increase nationally. The September quarter data continues to reflect the impact of weak economic activity on labour market conditions across age groups. See figure 3 for September year comparisons by age group from 2020 to 2025.
g) Employment in Palmerston North is improving, with the number of city-based jobs rising compared with the previous year. Growth is expected to continue into 2026, supported by export activity, lower mortgage rates, and increased investment from defence force consolidation and private and public sector projects. These factors are likely to boost spending and support levels of employment both in the city and nationally. Reflecting this, the Reserve Bank projects employment to grow by 80,000 between June 2025 and June 2026, signalling the expectation of a broader-based economic recovery.
Figure 3: Jobseeker benefit recipients by age group – September years

3.3 Earnings and income
Earnings growth slows as labour market weakens and wage pressures ease
a) Statistics NZ’s business collection data provides a timely, though less robust, measure of quarterly earnings at the territorial authority level. In the year to June 2025, total annual earnings in the city rose by 0.8%, compared with a 1.5% increase nationally. The slower growth reflects the impact of job losses and weaker labour market conditions, which have reduced wage pressures for employers.
b) Reflecting easing wage pressures, the Labour Cost Index (LCI) fell to 2.3% in the year to June 2025. This follows a period of strong wage growth between March 2022 and December 2024, when high private and public sector demand combined with labour shortages to drive up costs. These conditions have since reversed, with spare labour capacity emerging across the economy. The Reserve Bank expects this trend to continue, with labour cost growth projected to ease to 2.1% in the September 2025 quarter.
c) The Statistics NZ median salary and wages data for the year to June 2024, is beginning to reflect these weaker labour market conditions with median earnings in the city increasing by a lesser 6.8% over the year. This remains above median earnings growth of 4.9% nationally over the same period but below the 8.3% annual growth in earnings in the city in the 2023 calendar year. Median earnings growth is expected to continue easing toward the long-term average of 3.8% per annum.
3.4 Spending
Weak consumer spending continues across the New Zealand economy. Falling interest rates are expected to relieve household budget pressures, supporting an increase in spending in 2026.
a) Retail spending in the city decreased by 1.0% over the year to September 2025, to a total value of $1.49 billion. This compares with a 0.8% fall in retail spending nationally.
b) Spending on ‘groceries and liquor’ was the only storetype to increase, up 2.5% over the year. This growth rate remains below the annual rate of inflation of 3.0% thereby indicating negative real growth in spending in the category over the year[4]. ‘Groceries and liquor’ was the largest spending category with a total spend of $538.1 million in the city over the year.
c) Notably, lower fuel prices are taking some pressure off household budgets. Spending on ‘fuel and automotive’ goods in the city fell by $9.1 million over the year, influenced by not only soft demand for new vehicles but also lower fuel prices. This is consistent with Statistics New Zealand CPI data which indicates a 1.6% fall in petrol prices over the year to September.
d) Spending on discretionary goods remained weak over the year. Expenditure on home and recreational goods fell by $9.3 million (-2.5%), café, restaurant and bar spending declined by $4.1 million (-2.1%), and spending on apparel and personal items decreased by $3.9 million (-3.8%). This pattern in the city mirrors the national trend, with annual spending declining across all categories except ‘groceries and liquor’.
e) New car registrations in the city fell by 6.8% over the year to June 2025. This compares with a 9.3% fall nationally. In contrast, commercial vehicle registrations increased by 2.5% in Palmerston North. National commercial vehicle registrations were unchanged with a total of 41,249 vehicle registrations over the year.
f) A total of $298.4m in tourism spending flowed into the city over the year to June 2025. This is down 2.2% from the previous year compared with a 1.2% fall in tourism spending nationally. Tourism spending continued to be impacted by a pullback in spending by domestic travellers, falling 2.9% in the city and a greater 3.5% across New Zealand. In contrast, international tourism spending increased 5.2% to $27.8m in the city over the year. This compares with a 5.9% increase in international tourism spending nationally. At the time of writing, September quarter tourism data has not been released by the Ministry of Business, Innovation and Employment (MBIE).
3.5 Housing
Palmerston North’s housing market is stable, with rising sales and improving affordability.
a) House prices in the city increased 0.4% over the year to September 2025 to an average value of $631,762. National house prices eased 0.2% over the year to an average value of $900,52. The volume of house sales continued to strengthen in Palmerston North, with 1,363 houses sold in the year to September 2025. This is a 16.3% increase in sales volumes from the previous year compared with a 12.3% increase in sales volumes nationally. Elevated supply of houses for sale are keeping house prices relatively stable supporting housing affordability in the city.
b) Mortgage lending increased to $91.7 billion nationally, in the year to September 2025. This compares with $69.8 billion the previous year, representing a 31.4% increase in mortgage lending compared with the year ended September 2024. Mortgage lending to owner-occupiers and investors increased the most, up $13.1 billion (+32.7%) and $6.2 billion (+47.0%) respectively. Lending to first home buyers lifted by $2.4 billion (+15.7%) over the same period. The proportion of total mortgage lending to investors has increased to 21.1% after falling back to an historically low 16.5% in the year to June 2023.
c) Home ownership affordability, as measured by Infometrics as the ratio of the average house price to average annual income, remained at 4.7 in the June quarter 2025. This compares with the average house price of 6.5 times the average income, nationally.
d) Renting a home in Palmerston North is becoming more affordable. Average annual rents fell by 2.1% in the city over the year to August 2025 to an average price of $480 per week. This compares with a 0.2% increase in rents nationally to $569 per week. Over the same period, the number of properties rented increased by 2.7% in Palmerston North, compared with a 4.3% increase nationally. As at August 2025, 8,409 homes were formally rented in the city.
e) Renting in Palmerston North remains more affordable than many other parts of the country, with annual average rent equal to 20% of annual household income in June 2025. This compares with 22% nationally. Renting in Palmerston North continues to be more affordable than both the Manawatū District and the wider Manawatū-Whanganui region, with average annual rent taking up 21.1% and 22.3% of the average household income, respectively.
f) The number of households on the public housing register in Palmerston North fell by 54 (-10.0%) to a total of 486 over the year to September 2025. Note, this is an increase of 84 since the June 2025 quarter. National trends followed a similar trend with the number of families on the public housing register falling 11.5% annually but increasing since the June quarter. Note, alongside efforts to ensure the same family is not registered across multiple locations, the criteria for being placed on the housing register has been tightened, likely explaining a proportion of the reduction in households on the public housing register.
g) The number of families on the transfer register in Palmerston North sat at 144 in the September quarter 2025, down slightly from 147 a year ago but up from the June quarter where 135 families were on the register. Again, the national trend is similar with the number of families awaiting transitional housing falling 1.6% from September 2024 but increasing from the June quarter (+252).
h) The Ministry of Social Development has suppressed the September data on households in emergency housing in Palmerston North, indicating that only a small number of families accessed support. Consistent with this, the value of emergency housing grants in the city fell sharply, down from $590,898 in the September quarter 2024 to $28,895 in the September quarter 2025.
i) There were 426 consents for new dwellings issued in Palmerston North over the year to August 2025, an increase of 18 (4.4%) versus the previous year. This compares with a 1.3% increase in new dwelling consents issued nationally. While lower mortgage interest rates are likely to support levels of private residential development moving forward, the confirmed pullback in development by Kāinga Ora is expected to weigh on levels of development in the city.
j) Net dwelling analysis for the year to August 2025, estimates that 267 of the 426 dwellings consented, will add to Palmerston North’s housing stock. This represents 63% of total consents issued, compared with the longer-term annual average of 70%. The provisional total is slightly below the Long-Term Plan forecast of 273 dwellings per year for 2024–2027. The net dwelling series adjusts for relocations in and out of the city and for uplifted dwellings and is subject to revision.
4 Palmerston North electronic card spending report – september 2025
4.1 Despite ongoing weakness in consumer spending, visitor spend and loyalty of residents to local merchants keeps more dollars local.
a) Aggregate data for the city indicates that retail card spending fell by 1.0% in the city over the year to September compared to a 0.8% fall nationally. Further detail on consumer spending in the city can be found in section 3.4 of this report.
b) Focusing in on retail precincts in the city, spending in the city centre fell by 0.7% over the year, below the city and national decline of 1.0% and %0.8 respectively. The retail sectors most affected by the pullback in consumer spending were ‘arts, recreation & visitor transport’ falling 6.4%, ‘cafes, restaurants, bars and takeaways’ down 4.8%, and ‘apparel and personal’ spending down 4.4%. This is consistent with electronic card spending data nationally, where spending on non-essential goods and services have contracted due to constrained household budgets.
c) Of note, expenditure on ‘fuel and automotive’ fell by 2.9% in the city centre, -3.5% across the whole the city, and -4.7% across New Zealand as lower fuel costs helped to relieve pressure on household budgets.
d) In contrast, spending on ‘groceries and liquor’ and ‘other consumer spending’ posted an increase in card spending in the city centre over the year. The increase in food spending is influenced by higher food prices (+4.1% Statistics NZ Food Price Index) however, an increase in spending on discretionary items suggests some increase in appetite for spending on non-essential items. While spending on groceries and food followed a similar trend across the city and nationally, in contrast, other consumer spending fell 8.0% overall in the city over the year with spending nationally increasing by a lesser 0.3%. Trends in discretionary spending are being watched closely as an indication of increasing consumer confidence.
e) As expected, spending growth across all retail precincts in Palmerston North fell below the annual rate of inflation of 3.0%. ‘Palmerston North Inner CBD and Broadway Avenue’ fared the best, with annual spending dropping 0.5% followed by ‘Palmerston North City centre’ with a 0.7% decline in spending over the year.
f) From the June ‘Quarterly Electronic and Card Spending Report’, customer loyalty improved in Palmerston North over the year to June with 82.0% of resident spending retained in the city, up from 81.5% a year earlier. Resident spending outside the city fell 3.8%, a larger drop than the 1.4% decline in local spending, indicating that a greater share of spending stayed with local merchants. The city recorded a net gain of $293 million, as visitor spending in Palmerston North exceeded residents’ spending outside the city.
g) The Quarterly Economic Card Spending Report for September 2025 is attached as Attachment 2.
5 Economic outlook
5.1 The latest GDP data highlights the continuation of challenges facing the New Zealand economy. The city has not been immune to these pressures, as reflected in rising Jobseeker benefit numbers and fewer residents in paid employment in the city.
5.2 Further weakening of the New Zealand economy in the June quarter was chiefly driven by a contraction in goods producing industries, with particular weakness in manufacturing and construction activity. In contrast, investment levels have been a bright spot for the city. Non-residential construction consents in Palmerston North have surged, underpinned by private developments across industrial, accommodation, and commercial buildings. Employment in Palmerston North has also bucked the national trend, increasing 1.3% over the year to June compared with a 1.7% contraction nationally. These factors combined suggest some strengthening in local economic activity.
5.3 Times have been tough though and continue to be, for many households and businesses across New Zealand and our local economy. The weaker than expected GDP result for the June quarter comes with a silver lining. The evidence base is there to support the easing of interest rates at pace to support the recovery of the New Zealand economy with the RBNZ acting swiftly in response to weak economic data in the October OCR review. Lower interest rates will take pressure off household and business budgets, raising the confidence of consumers to spend more broadly across the economy. In time, this will support business profitability, enabling greater investment and recruitment, and helping to drive a broad based recovery of the New Zealand economy. It will take time.
5.4 There are economic strengths in the city that support economic activity. Our large and diverse public sector is drawing central government investment and supporting job creation in the region. Our multi modal distribution and logistics network is attracting private investment and supporting levels of employment in transport, wholesale trade and construction. Our strategic location as not only a distribution and logistics hub for the central and lower North Island, but also as a provincial city serving a strong rural economy also supports the resilience of the Palmerston North economy. The city’s industry strengths combined with lower borrowing costs and a strong investment pipeline, point to a firmer outlook for 2026.
5.5 Factors that influence economic conditions in the city will continue to be reported on throughout the quarterly economic reporting series.
6 Compliance and administration
|
Does the Council have delegated authority to decide? |
Yes |
|
|
Are the decisions significant? |
No |
|
|
If they are significant do they affect land or a body of water? |
No |
|
|
Can this decision only be made through a 10 Year Plan? |
No |
|
|
Does this decision require consultation through the Special Consultative procedure? |
No |
|
|
Is there funding in the current Annual Plan for these objectives? |
Yes |
|
|
Are the recommendations inconsistent with any of Council’s policies or plans? |
No |
|
|
The recommendations contribute to: Whāinga 1: He tāone auaha, he tāone tiputipu Goal 1: An innovative and growing city |
||
|
The recommendations contribute to this plan: 2. Mahere whakawhanake ohaoha 2. Economic Development Plan The objective is: Support sustainable business activity and labour market development, in particular, providing information and education resources to city businesses. |
||
|
Contribution to strategic direction and to social, economic, environmental and cultural well-being |
Reporting on economic trends in the city and the longer-term outlook for growth, is important for encouraging local business to invest, growing their business and attracting new businesses to the city. It is also important to support businesses to make informed decisions based on current economic conditions and to provide information to Councillors to support decision making. |
|
|
1. |
Palmerston North Economic Growth
Indicators - October 2025 ⇩ |
|
|
2. |
Palmerston North Quarterly
Economic Card Spending Report - September 2025 ⇩ |
|
TO: Council
MEETING DATE: 12 November 2025
TITLE: Annual Summary of Economic Impact and Benefits of Council Supported Events
PRESENTED BY: Luke McIndoe, Manager Venues + Events Partnerships
APPROVED BY: Danelle Whakatihi, General Manager Customer & Community
1. That Council receive the memorandum titled ‘Annual Summary of Economic Impact and Benefits of Council Supported Events’, presented on 12 November 2025.
1. ISSUE
1.1 Council provides funding to support the attraction, development, and growth of events in Palmerston North, by supporting world class events that drive sustainable growth in domestic visitation and promotes Palmerston North’s unique identity to a wider audience through Council’s Major Event Fund.
1.2 To meet application requirements of the Major Event Fund, event producers must demonstrate how their projects contribute to Council’s goal of being an innovative and growing city. Officers utilise this information to inform funding decisions for the Major Events Fund through estimated economic impact analysis. Additional data is requested to compare estimated data with actual data gathered by the event producers during the running of the event and provided to Council Officers within six weeks of event delivery.
1.3 Accurate and appropriate data from event producers has been an ongoing issue and Officers have been developing metrics for event producers to help inform reporting and decision making. This data includes accurate visitation statistics and spending data for event attendees, organisers, competitors and for the event itself. These metrics are requested for applications and post event reporting of the Major Events Fund. This allows for comparison between what was planned and what has been delivered by events that receive Council’s grant funding.
2. BACKGROUND
Table 1: Events Funded by Palmerston North City Council via Major Event Fund 2024/2025 and their grant funding allocations
|
Event |
Amount |
|
New Zealand Young Performer Awards |
$24,000 |
|
Manawatu Arts Trail |
$20,000 |
|
Armageddon Expo |
$15,000 |
|
Palmy Drag Fest |
$30,000 |
|
Kiwibots Vex National Championships |
$15,000 |
|
Davis Cup World Cup of Tennis |
$30,000 |
|
Central District Field Days |
$30,000 |
|
Salud Festival |
$20,000 |
|
Daybreaker Rally |
$20,000 |
|
NZ Rural Games* |
$75,000 |
*NZ Rural Games is funded via a separate programme; however their funding is guided by the metrics established by the Support and Funding Policy 2022 for the Major Event Fund.
2.1 Palmerston North City Council, along with several other city councils and central government, utilise Event Economics by Fresh Info to analyse raw data provided by applicants.
2.2 Fresh Info utilises cost benefit analysis (CBA) to estimate impact. Economic benefit analyses provide comparison between a gross versus net regional benefit. This can demonstrate the benefits that are purely event related and specific to the city. A higher net benefit indicates greater regional impact and spend.
2.3 Reporting generated by Event Economics provides a gross economic benefit and a net economic benefit. While traditional reporting indicates a gross benefit or increase to regional GDP, this methodology is a blunt tool and doesn’t take into account spend outside of region, distribution of event profit and impact from economic activity that is not actualised within region.
2.4 A summary of gross and net benefit is provided below for events that received Major Event Fund grant funding in the 2024/2025 financial year. A number of these recipients have multi-year funding agreements. This reporting is for the event run in the relevant financial year only.
Table 2: Estimated economic benefit of Council supported events 2024/2025
|
Event |
Gross Benefit |
Net Benefit |
|
New Zealand Young Performer Awards |
$1,203,100 |
$327,075 |
|
Manawatu Arts Trail |
$554,608 |
$145,547 |
|
Armageddon Expo |
$2,179,080 |
$387,645 |
|
Palmy Drag Fest |
$696,750 |
$188,938 |
|
Kiwibots Vex National Championships |
$262,220 |
$73,357 |
|
Davis Cup World Cup of Tennis |
$1,696,164 |
$323,314 |
|
Central District Field Days |
$30,692,961 |
$6,125,231 |
|
Salud Festival |
$444,850 |
$116,850 |
|
Daybreaker Rally |
$2,299,150 |
$723,388 |
|
NZ Rural Games* |
$4,797,860 |
$1,417,429 |
|
TOTAL |
$44,826,743 |
$9,828,774 |
*Please note that this figure differs from NZRGT’s report as this report uses different reporting and assessment methodology.
2.5 Return on investment for Council funding within the Major Event Fund when utilising net regional benefit is substantial and meaningful. Events listed above generate nearly $10 million dollars of actualised regional benefit.
2.6 This report shows a notable increase in economic benefit (2023/2024 - $7,970,651 vs 2024/2025 $9,828,774). This shows the impact of increased reporting measures and work of Officers and event producers to focus on initiatives that drive economic benefit such as use of local contractors, re-investment in local business and increasing bed nights per event.
2.7 Quality of data continues to be a concern for Officers and the quality and validity of reporting is contingent on accurate and appropriate metrics provided by event producers in the assessment and post-event reporting phases. Funding contracts have been reviewed and now include specific reference to the information required to ensure accurate reporting to assist Officers.
2.8 Economic Impact reporting can be viewed alongside other tools such as Marketview retail spending; however this data does not isolate spending directly on event activity, but it does help in painting a wider picture of economic activity in the city while events are taking place.
3. NEXT STEPS
3.1 This report continues to develop a picture of the economic impact and benefits that major events provide to the city. Annual tracking of economic data is beginning to show a picture of the benefits that events provide to the city and future reports will expand to include other events that receive council support in other ways as well as events that do not receive direct council funding but do utilise venues within the city.
3.2 Council Officers will continue to gather data from event producers to inform the future of the fund and to identify possible leverage opportunities that maximise social benefit to residents alongside economic benefit as a direct result of grant funding provided to the events industry.
4. Compliance and administration
|
Does the Committee have delegated authority to decide? |
Yes |
|
|
Are the decisions significant? |
No |
|
|
If they are significant do they affect land or a body of water? |
No |
|
|
Can this decision only be made through a 10 Year Plan? |
No |
|
|
Does this decision require consultation through the Special Consultative procedure? |
No |
|
|
Is there funding in the current Annual Plan for these objectives? |
Yes |
|
|
Are the recommendations inconsistent with any of Council’s policies or plans? |
No |
|
|
The recommendations contribute to: Whāinga 1: He tāone auaha, he tāone tiputipu Goal 1: An innovative and growing city |
||
|
The recommendations contribute to: Whāinga 1: He tāone auaha, he tāone
tiputipu Whāinga 2: He tāone whakaihiihi, tapatapahi ana |
||
|
The recommendations contribute to this plan: 2. Mahere whakawhanake ohaoha 2. Economic Development Plan The objective is: Residents and visitors have opportunities to attend a range of major events in Palmerston North. Local communities and businesses benefit from the vibrancy and the economic activity that major events and activities bring to the city. |
||
|
Contribution to strategic direction and to social, economic, environmental and cultural well-being |
Events funded by Council through grant funding provide wider economic benefits to the city.
|
|
Nil

TO: Council
MEETING DATE: 12 November 2025
TITLE: Atawhai Park and Walkway - Land Exchange with Massey University: Hearing of Submissions
1. That Council receive the submissions and hear submissions from presenters who indicated their wish to be heard in support of their submission.
2. That Council note the Procedure for Hearing of Submissions, as described in the procedure sheet.
Submitters wishing to be heard in support of their submission
|
Submission No. |
Submitter |
|
22 |
Kim Bergerson |
|
30 |
Massey University |
|
20 |
Judith Theng |
|
1. |
Submissions on Atawhai Park and
Walkway - Land Exchange with Massey University ⇩ |
|
|
2. |
Procedure Sheet ⇩ |
|
TO: Council
MEETING DATE: 12 November 2025
TITLE: Atawhai Park and Walkway - Land Exchange with Massey University: Summary of Submissions and Deliberations
Presented By: Perene Green, Property Officer and Kathy Dever-Tod, Manager Parks and Reserves
APPROVED BY: Glen O'Connor, Acting General Manager Infrastructure
1. That Council approve the land exchange with Massey University in accordance with Section 138 of the Local Government Act 2002, noting that:
a. The land being exchanged to Massey University from Council would be approximately 564 sqm of Lot DP 48076.
b. The land being exchanged to Council from Massey University would be approximately 541 sqm of Part Section 208 TN of Fitzherbert.
c. Council would receive easements:
i. over Lot 11 DP 18880 (91 Atawhai Road) legalising the existing walking path access to Atawhai Park;
ii. over Part Section 208 TN of Fitzherbert retaining legal access of the existing walkway from Atawhai Park to Bledisloe Park; and
iii. a new easement over Part Section 208 TN of Fitzherbert allowing for a future walkway to be developed from Springdale Park to Bledisloe Park.
1. ISSUE and background
1.1 Massey University wish to subdivide a portion of land off Atawhai Road that was inadvertently landlocked when Atawhai Park was transferred to Council in 1981.
1.2 Council has the opportunity to undertake a land exchange that would rectify discrepancies in land ownership and occupation, including securing easements for future public walkways, and enhance the overall functionality and accessibility of Atawhai Park.
1.3 Figure 1 shows the landholdings:
· Area 1, in red, is the land being exchanged from Massey to Council. This is approximately 541m².
· Area 2, in orange, is the land being exchanged from Council to Massey University. This is approximately 564m².
![]() Figure 1: Existing landholdings
and landlock by walkway
Figure 1: Existing landholdings
and landlock by walkway
1.4 Figure 2 shows the proposed easements for walkways, in favour of Council, to be received as part of the exchange.
· Easement 1 – easement across 91 Atawhai Road to formalise access to Atawhai Park.
· Easement 2 – easement over the existing walkway to Bledisloe Park to Atawhai Park, which will be dissolved after the construction of the future walkway, being easement 3.
· Easement 3 – easement from Springdale Park through to Bledisloe Park for a future walkway track.
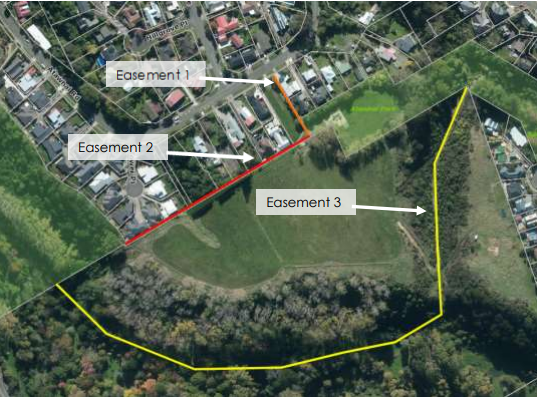
Figure 2: Proposed easements
1.5 Council received the report titled ‘Atawhai Park and Walkway – Land Exchange with Massey University’ at the Council meeting of 3 September 2025, which requested to consult with the public on the proposed land exchange part of Atawhai Reserve. Resolved:
1) That Council proceed with the public consultation on the proposed land exchange with Massey University noting that:
a. The land being exchanged to Massey University from Council would be approximately 564m² of Lot 1 DP 48076.
b. The land being exchanged to Council from Massey University would be approximately 541m² of Part Section 208 TN of Fitzherbert.
c. Council would receive easements:
i. over Lot 11 DP 18880 (91 Atawhai Road) legalising the existing walking path access to Atawhai Park;
ii. over Part Section 208 TN of Fitzherbert retaining legal access of the existing walkway from Atawhai Park to Bledisloe Park; and
iii. a new easement over Part Section 208 TN of Fitzherbert allowing for a future walkway to be developed from Springdale Park to Bledisloe Park.
1.6 Under Section 138 of the Local Government Act 2002, Council is required to seek community feedback on any proposed exchange of recreation reserve land.
1.7 The public notification process is now complete.
1.8 This report seeks a final decision from Council to proceed with the land exchange between Massey University and Council and to authorise the Chief Executive to execute the associated Land Exchange and Easement Agreements, noting that submissions against the proposal relate primarily to broader district plan matters rather than the land exchange or easements themselves.
2. Consultation overview
2.1 Consultation took place from 18 August to 19 September 2025. The consultation consisted of:
· Public notice in the Manawatū Standard;
· Public notice in the Manawatū Guardian;
· Billboard on the site;
· Online advertisement on the Council website;
· A letter-drop to the neighbours within 500 metres; and
· Drop-in session (invite only) – this was requested by a neighbourhood representative.
3. Summary of submissions
3.1 Thirty-five (35) submissions were received during the consultation period. Submitters identified their support or otherwise of the proposal.
· Twenty-four (24) submissions were for;
· four (4) against; and
· seven (7) remained ‘unsure’.
3.2 Overall, feedback was generally supportive of the proposal, with the majority of submitters recognising the practical benefits of formalising access and improving walkway safety.
3.3 A smaller number of submitters raised concerns relating to potential future development, traffic, or track maintenance, most of which are outside the scope of the land exchange proposal.
3.4 Officers received a request for a meeting to clarify aspects of the proposal. The meeting was attended by approximately twelve residents and two Council officers from the City Planning and Parks and Reserves teams. The matters raised were consistent with those outlined in the table below. Attendees were invited to make a formal submission on the proposal.
3.5 Table 1 below summarises the matters raised in the written submissions in relation to the land exchange proposal. Please note totals do not equal the number of submissions as more than one matter was raised in some submissions.
|
Table 1: Summary of Submissions Relating to Land Exchange and Easements |
||
|
Matters Raised |
Total |
Officer Comments |
|
Comments For |
||
|
1. It makes sense/common sense decision |
15 |
Officers acknowledge this feedback. The proposed change is considered a practical solution that simplifies land management and supports safer long-term use. |
|
2. Seen as mutually beneficial / positive for both parties / simplifies land management |
8 |
Officers note that the land exchange and easement arrangement provides benefits for both landowner and Council. |
|
3. Easement 3 offers a safer, easier, and more maintainable route |
3 |
Officers confirm that Easement 3 would be safer for public use, and can be maintained more effectively than the current alignment. |
|
4. Easement 2 is hazardous, hard to maintain, and Council struggles with upkeep |
2 |
Officers agree that Easement 2 presents maintenance challenges. Easement 3 addresses these concerns by offering a more suitable alignment. Attachment 1 provides onsite images of a previous slip that led to a reroute of the track. |
|
5. Steep track down Bledisloe Park provides a better level of exercise that is not available on a flat walk |
2 |
Acknowledged. Officers recognise that the Bledisloe track offers a higher level of physical challenge. There is an alternative track that starts/ends next to 137 Atawhai Road, crossing Massey land next to their water tower, that also offers steeper, more challenging walking and there are various other gullies in the wider area. The Te Arapiki a Tane stairway at Te Motu o Poutoa/Vaucluse Heights offers vigorous recreation opportunities. |
|
6. Supports the proposal, as long as all easements are secured |
2 |
Officers note the importance of securing easements to ensure long-term access and certainty for both residents and Council. |
|
7. Green spaces are essential |
2 |
Acknowledged. Council recognises the importance of green spaces for community wellbeing and has sought to retain and enhance these spaces within the proposal. |
|
8. Disappointed to see the Bledisloe track closed |
1 |
The Bledisloe track is not confirmed to be closed in any particular timeframe. Easement 3 has been secured to ensure that if further slips or safety concerns arise, an alternative route is available. |
|
9. Easement 3 is a pleasant walk through the Arboretum |
1 |
Officers recognise the value of Easement 3 in enhancing the recreational experience through the Arboretum. |
|
10. Retaining the existing route would be more favourable for local residents |
1 |
Noted. There is an alternative track that starts/ends next to 137 Atawhai Road, crossing Massey land next to their water tower. It requires walking further along Atawhai Road but is the same distance to get from 91 Atawhai Road to the bottom of the slope. |
|
11. Requests that Easement 3 link be developed within 2 years |
1 |
Easement 3 would be constructed as a replacement for the existing track when required and is therefore a renewal programme. Programme 1834 covers walkways renewals across the city. It is not proposed that this replacement occur until such time as the existing track requires replacement, which is not currently envisioned to occur in the next two years. Assumptions about timing will be considered in future programme revisions for Asset Management and Long-Term Plans. |
|
Neutral |
|
|
|
1. Easement 3 and proposed route can be steep, muddy, or boggy during floods |
3 |
Officers note that improvements will be required to make Easement 3 safe and accessible. These works would be considered through the Parks and Reserves Asset Management Planning. |
|
2. Tracks on Easement 1 and 2 are well used |
2 |
Acknowledged. Officers are aware that Easements 1 and 2 are valued by the community. However, ongoing safety and maintenance issues make Easement 2 less sustainable in the long term. |
|
3. Lack of clarity around proposed access routes and future tracks on billboard and letter |
2 |
Noted. The letter drops and billboard only contained high level information. Both advised further information was provided on the Council website. |
|
4. Concern about losing recent upgrades to Easement 1 |
1 |
Noted. The proposal ensures that the upgrades within 91 Atawhai Road will not be lost if we proceed with Easement 1. |
|
5. Funds should be prioritised to make Easement 3 safe and accessible |
1 |
Supported. Officers agree that investment will be necessary to ensure Easement 3 is a safe, year-round route for the community. Assumptions about timing will be considered in future programme revisions for Asset Management and Long-Term Plans. |
|
6. Enjoyment of the area within Bledisloe Park that includes the steep incline |
1 |
Acknowledged. Officers understand that some users value the physical challenge offered by the steep incline. There is an alternative track that starts/ends next to 137 Atawhai Road, crossing Massey land next to Massey’s water tower. |
|
7. Not a net benefit to Council |
1 |
Noted. Officers consider that securing easements provides long-term benefits by improving safety, reducing maintenance costs, and enhancing alignment with wider network connections. |
|
8. Easement 2 could be removed before a replacement is built, risking loss of public access |
1 |
It is intended that Easement 2 will be dissolved only once Easement 3 and the replacement walkway is completed. The exception would be a major unexpected failure of the existing track. |
|
9. Easement 3 is considered less convenient and less accessible for residents |
1 |
Officers acknowledge this concern. |
|
10. Insufficient evidence demonstrating that constructing and maintaining a new walkway would provide better value than remediating the existing route |
1 |
Council officers have consulted operational staff responsible for walkway maintenance. While no financial modelling has been completed, construction and maintenance staff advise that Easement 3 would be easier and more cost-effective to maintain. |
|
Against |
||
|
1. Easement 2 is very popular and should be maintained |
2 |
Noted. Officers acknowledge the popularity of Easement 2 with local users. However, it has significant safety and maintenance issues, making Easement 3 the more sustainable long-term alignment. |
|
2. Lack of clarity around proposed access routes and future tracks on billboard and letter |
1 |
Noted. The letter drops and billboard only contained high level information. Both advised further information was provided on the Council website. |
|
3. Existing access to Atawhai Park already available |
1 |
The access between 73 and 81 Atawhai Road is relatively hidden and approximately 3.7m wide. Easement 1 would secure a 6 – 7m wide access that is more visually open and features as the main Atawhai Road access to the park currently. |
|
4. Maintaining or repairing the existing walkway would be more cost-effective and consistent with Council’s management of other local tracks |
1 |
Council officers have consulted operational staff, who advise that Easement 3 would be easier and more cost-effective to maintain. |
3.6 Table 2 below summarises the matters in the written submissions that are not related to the land exchange proposal. Please note, totals do not equal the number of submissions as more than one matter was raised in some submissions.
|
Table 2: Summary of Submissions Relating to Other Matters |
||
|
Matters Raised |
Total |
Officer Comments |
|
Comments For: |
||
|
1. For further housing on the site |
2 |
A housing development is not the focus of this decision; this comment is noted. |
|
2. Upgrade on the current playground |
1 |
Acknowledged. |
|
3. Complements the Te Waimana o Turitea project |
1 |
Noted. The Te Waimana o Turitea project is Massey University Foundation project. |
|
4. Remove the Poplar trees and large macrocarpa trees on the boundary of the existing Atawhai Park; to encourage the Totara trees to develop |
1 |
Suggestion noted. Under current policy mature trees are not removed unless criteria such as tree health, health and safety, or unreconcilable issues with boundaries are triggered. Future revision of trees on the park can consider the suggestion. |
|
5. Hopes that if the land is developed that the green space and views of Tararua Ranges are still available from the tracks |
1 |
Acknowledged. |
|
6. Would be prudent to provide future vehicle access across Easement 3 to Massey to develop land across gully, behind houses on Springdale Grove |
1 |
Acknowledged. |
|
7. If there is a residential development, there should be a connection between the public road and Easement 3 |
1 |
This would be considered as part of a private plan change process. Council Parks officers would support the suggested connection. |
|
8. Traffic and pedestrian safety improvements are required if further development occurs |
1 |
Noted. Such improvements would be assessed as part of any future private plan change process. |
|
Neutral |
|
|
|
1. Concern that the proposal may lead to urban development by Massey |
3 |
Any potential future development would be subject to a private plan change process, including opportunities for public input under the Resource Management Act. |
|
2. The intersection to access Atawhai is dangerous; any further development will further exacerbate the issue |
2 |
Traffic safety at the Atawhai intersection would be assessed through a private plan change process if future development was proposed. |
|
3. The proposal is primarily intended to enable future subdivision by Massey. This intent has not been clearly communicated. |
2 |
The current decision focuses on the land exchange and associated easements, in accordance with the requirements of the Local Government Act (LGA). A private plan change has not been applied for. |
|
4. Worried about financial gain motivations behind Massey’s development |
1 |
Not relevant for Councils and exchange consideration. |
|
5. Disappointment in officer not attending drop-in meeting |
1 |
The officer was unable to attend due to personal reasons. The Manager of Parks and Reserves and Principle Planner attended the session to ensure accurate information and appropriate support were provided to the community. |
|
6. If any further housing development occurs, residents would like opportunity to provide input. |
1 |
Any private plan change would require consultation with affected residents and notification of the proposal. |
|
Against |
|
|
|
1. The subdivision would result in residential development |
3 |
The land is currently zoned rural so precludes residential development. |
|
2. Concern that housing development would make the Atawhai intersection unsafe with increased traffic. |
2 |
Traffic safety at the Atawhai intersection would be assessed through a private plan change process if future development was proposed. |
|
3. Disagrees with 91 Atawhai being made into a roadway. |
2 |
Officers confirm that the current proposal does not include developing 91 Atawhai as a roadway. Any such proposal would be a separate process. |
4. hearings
4.1 Submitters who expressed a view on the proposal and indicated that they wished to be heard have been contacted by staff and invited to speak at the scheduled hearing on 12 November 2025.
4.2 The hearing of submitters who have requested to be heard will occur on the same day this report is presented to Council. Should any submissions raise new or substantive matters not previously addressed through the consultation process, Council officers will provide advice to Council during the meeting.
4.3 If these matters are assessed as significant, officers may recommend that a final decision be deferred to a subsequent Council meeting to allow adequate consideration and response.
5. conclusion
5.1 Subject to hearings, the proposed land exchange and easements between Massey University and Council addresses long-standing land ownership inconsistencies while enhancing public access, safety, and connectivity across Atawhai Park and the wider walkway network.
5.2 The outcome of consultation demonstrates general community support, with concerns largely relating to matters beyond the scope of the proposal.
5.3 Proceeding with the exchange will provide long-term benefits to both parties, strengthen recreation infrastructure, and support Council’s strategic objectives to provide city parks, reserves and walkways.
6. next steps
6.1 That Land Acquisition Agreements be prepared and executed for the two parcels of land being exchanged.
6.2 That Easement Agreements in Gross be prepared and executed as required.
6.3 If Council does not proceed with the exchange, the current discrepancies in land ownership and access would remain unresolved, limiting opportunities to secure long-term public access and improve walkway safety.
7. Compliance and administration
|
Does the Council have delegated authority to decide? |
Yes |
|
|
Are the decisions significant? |
No |
|
|
If they are significant do they affect land or a body of water? |
No |
|
|
Can this decision only be made through a 10 Year Plan? |
No |
|
|
Does this decision require consultation through the Special Consultative procedure? |
No |
|
|
Is there funding in the current Annual Plan for these objectives? |
Yes |
|
|
Are the recommendations inconsistent with any of Council’s policies or plans? |
No |
|
|
The recommendations contribute to: Whāinga 1: He tāone
auaha, he tāone tiputipu |
||
|
The recommendations contribute to this plan: 6. Mahere rēhia 6. Recreation and Play Plan The objective is: Provide city, suburb and local parks and reserves, including sports fields, courts, tracks, changing rooms and facilities, and walkways. |
||
|
Contribution to strategic direction and to social, economic, environmental and cultural well-being |
The land exchange and easements enable Council to improve the resilience of a length of the Te Araroa Trail and formalise existing access into Atawhai Park. The new walkway easement would secure public walking access into Massey University and walking through the Arboretum will add a new experience to the walkway network. The new walkway between Bledisloe Park and Atawhai Park will provide greater access for the community due to the improved gradient. The land exchange unlocks the potential for underutilised Massey land to be used for another purpose, contributing to the wellbeing of the city. |
|
|
1. |
Bledisole Park - Site Photos ⇩ |
|
TO: Council
MEETING DATE: 12 November 2025
TITLE: Fitzherbert Park - Proposal to grant Easement to Power: Deliberations Report
Presented By: Perene Green, Property Officer
APPROVED BY: Glen O'Connor, Acting General Manager Infrastructure
1. That Council grant an easement to convey electricity at Fitzherbert Park, 272 Fitzherbert Avenue, Palmerston North, to Powerco.
2. That Council note that the land area affected by the easement for Powerco is described as Lot 2 DP 77988.
1. ISSUE
1.1 Powerco are planning to complete upgrades to an existing transformer located within Fitzherbert Park.
1.2 The aerial location of the transformer and switchgear within Fitzherbert Park is shown below in red in Figure 1. Figure 2 provides a concept of the transformer on site.

Figure 1: Aerial view

Figure 2: Onsite view
1.3 Fitzherbert Park is subject to the Palmerston North Reserves Act 1922, which does not set out a process for easements on reserve land.
1.4 Although Fitzherbert Park is not subject to the Reserves Act 1977, this Act requires that any utility services located on reserve land be covered by an easement. In the interests of consistency and good practice, Officers recommended following the process set out in the Reserves Act 1977 for all applications for easements over reserve land.
1.5 The public notification process has been completed following the process set out in Section 48 of the Reserves Act 1977. There were no submissions received.
1.6 This report seeks approval from Council to grant the formal easement for this matter.
2. BACKGROUND
2.1 A report to Council titled ‘Fitzherbert Park – Proposal to Grant an Easement on Reserve Land to Power’ on 3 September 2025 assessed the proposal and as a result Council resolved:
1. That Council approve notifying the public of the proposal to grant an easement at Fitzherbert Park, 272 Fitzherbert Avenue, Palmerston North to Powerco to convey electricity, using the process set out in Section 48 of the Reserves Act 1977.
2. That Council note that the land area affected by the easement for Powerco is described as Lot 2 DP 77988
2.2 Consultation was completed in October 2025. No submissions were received.
2.3 If the easement is granted the easement instrument will be entered between Council and Powerco and added to the relevant property tittle.
3. Conclusion
3.1 Granting of the easement followed the process outlined in the Reserves Act 1977.
3.2 Given that the process outlined in the Reserves Act 1977 was followed, and no objections to the proposed easement were received, it is recommended that Council grant an easement to convey electricity to Powerco.
4. NEXT STEPS
4.1 The easement instrument will be entered between Council and Powerco and added to the relevant property title.
5. Compliance and administration
|
Does the Council have delegated authority to decide? |
Yes |
|
|
Are the decisions significant? |
No |
|
|
If they are significant do they affect land or a body of water? |
No |
|
|
Can this decision only be made through a 10 Year Plan? |
No |
|
|
Does this decision require consultation through the Special Consultative procedure? |
No |
|
|
Is there funding in the current Annual Plan for these objectives? |
Yes |
|
|
Are the recommendations inconsistent with any of Council’s policies or plans? |
No |
|
|
The recommendations contribute to: Whāinga 3: He hapori tūhonohono, he hapori
haumaru |
||
|
The recommendations contribute to this plan: 6. Mahere rēhia 6. Recreation and Play Plan The objective is: Administer the Reserves Act 1977 |
||
|
Contribution to strategic direction and to social, economic, environmental and cultural well-being |
This action ensures Council decision making is consistent with the provisions of the Reserves Act 1977 with regards to reserves planning and legislative requirements for utilities sited in reserves. |
|
Nil

TO: Council
MEETING DATE: 12 November 2025
TITLE: Palmerston North Performing Arts Trust - Annual Report and Annual Accounts 2024/25
PRESENTED BY: Hannah White, Manager Governance
APPROVED BY: Cameron McKay, General Manager Corporate Services
1. That Council receive the Palmerston North Performing Arts Trust Annual Report and financial statements for the year ended 30 June 2025 (Attachments 1-3).
1. ISSUE
1.1 The Palmerston North Performing Arts Trust (‘the Trust’) has submitted its Annual Report and financial statements 2024/25, as expected under clause 7.5 of its Trust Deed (see Attachments 1-3).
1.2 The Trust is an exempted Council Controlled Organisation under section 7 of the Local Government Act (LGA) 2002, as its small size makes the reporting requirements and mandatory audit of the LGA disproportionate to the size of the Trust.
2. BACKGROUND
2.1 The Palmerston North Performing Arts Trust was established in 1998 by Council to provide educational opportunities for the development of talented emerging performing artists in the Palmerston North region.
2.2 To do this, the Trust runs the ‘Arts Heart’ Educational Development Project Scheme (up to $5,000 per project) which is designed to assist the education and development of group performance art projects in Palmerston North. In 2024/25 the Trust awarded three grants of $5,000, $4,300 and $3,500 to emerging groups, the details of which are covered in the Chairperson’s Report attached.
3. NEXT STEPS
3.1 The Annual Report and financial statements for the year ended 30 June 2025 will be lodged with Charities Services.
4. Compliance and administration
|
Does the Council have delegated authority to decide? |
Yes |
|
|
Are the decisions significant? |
No |
|
|
If they are significant do they affect land or a body of water? |
No |
|
|
Can this decision only be made through a 10 Year Plan? |
No |
|
|
Does this decision require consultation through the Special Consultative procedure? |
No |
|
|
Is there funding in the current Annual Plan for these objectives? |
No |
|
|
Are the recommendations inconsistent with any of Council’s policies or plans? |
No |
|
|
The recommendations contribute to: Whāinga 2: He tāone
whakaihiihi, tapatapahi ana |
||
|
The recommendations contribute to this plan: 14. Mahere mana urungi, kirirarautanga hihiri 14. Governance and Active Citizenship Plan The Objective is: Oversee Council operations and communicate decisions to our communities |
||
|
Contribution to strategic direction and to social, economic, environmental and cultural well-being |
Receiving this information contributes to the desired outcome of an effective and responsible Council that excels in good governance.
|
|
|
1. |
Covering letter from
Chairperson_October 2025 ⇩ |
|
|
2. |
Chairperson's Report 2025 ⇩ |
|
|
3. |
Financial Statements for the
year ended 30 June 2025 ⇩ |
|
[1] Part 2.1 – Page 11
[2] This is actual dwellings and does not include the 20% margin required to be placed on land supply under the National Policy Statement - Urban Development (NPS UD).
[3] Electricity prices contributed 10.1% of the 3.0% increase in consumer prices over the year, alongside a 9.2% contribution from actual rentals for housing and local authority rates respectively.
[4] Negative real growth is defined as annual retail spending growth that falls below the annual rate of inflation.